Fig. 19.
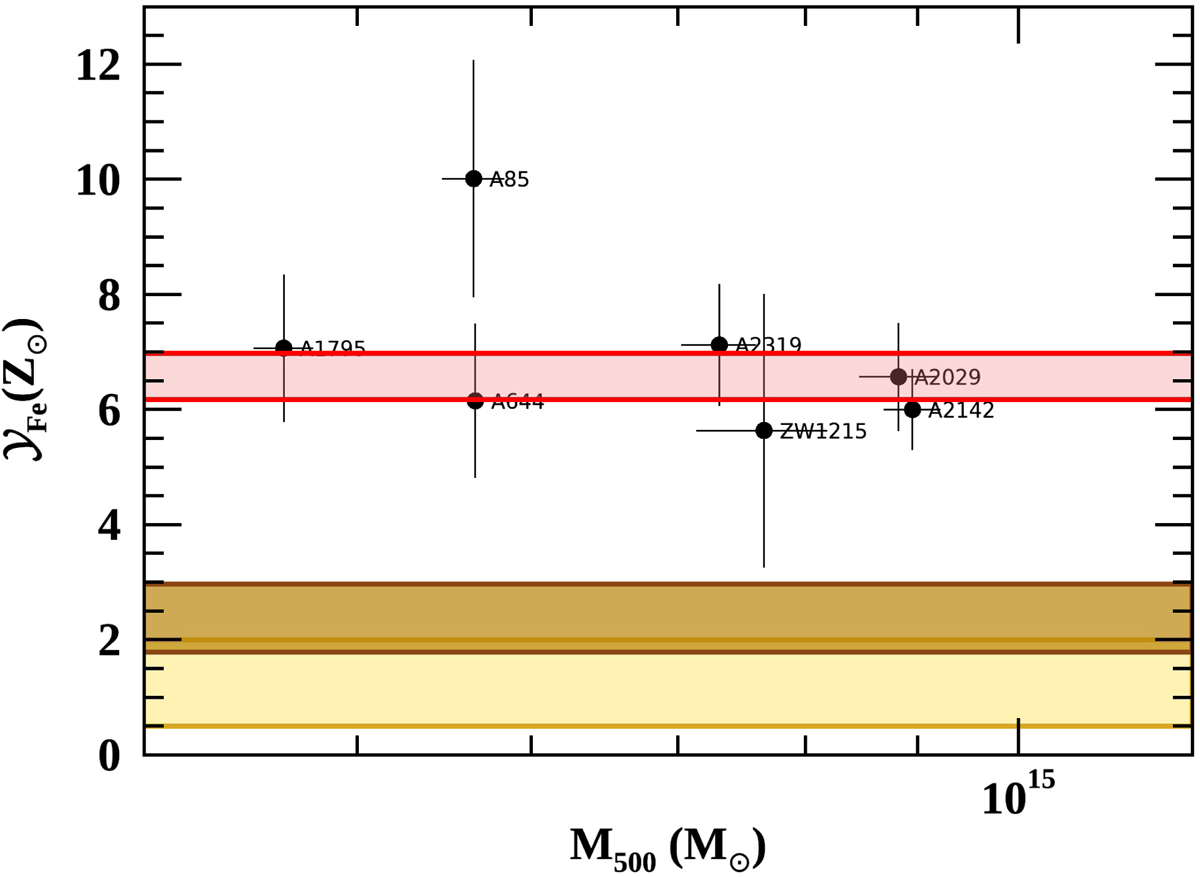
Effective iron yield for the clusters of the sample. The red band is the 68% confidence interval around the mean. The yellow band shows the expected value computed through the SN yields derived from Maoz & Graur (2017) and Renzini & Andreon (2014; see text for details); the gold band represents the expected value derived assuming recent estimates for SNIa rates in galaxy clusters by Freundlich & Maoz (2021).
Current usage metrics show cumulative count of Article Views (full-text article views including HTML views, PDF and ePub downloads, according to the available data) and Abstracts Views on Vision4Press platform.
Data correspond to usage on the plateform after 2015. The current usage metrics is available 48-96 hours after online publication and is updated daily on week days.
Initial download of the metrics may take a while.