Free Access
Fig. 5
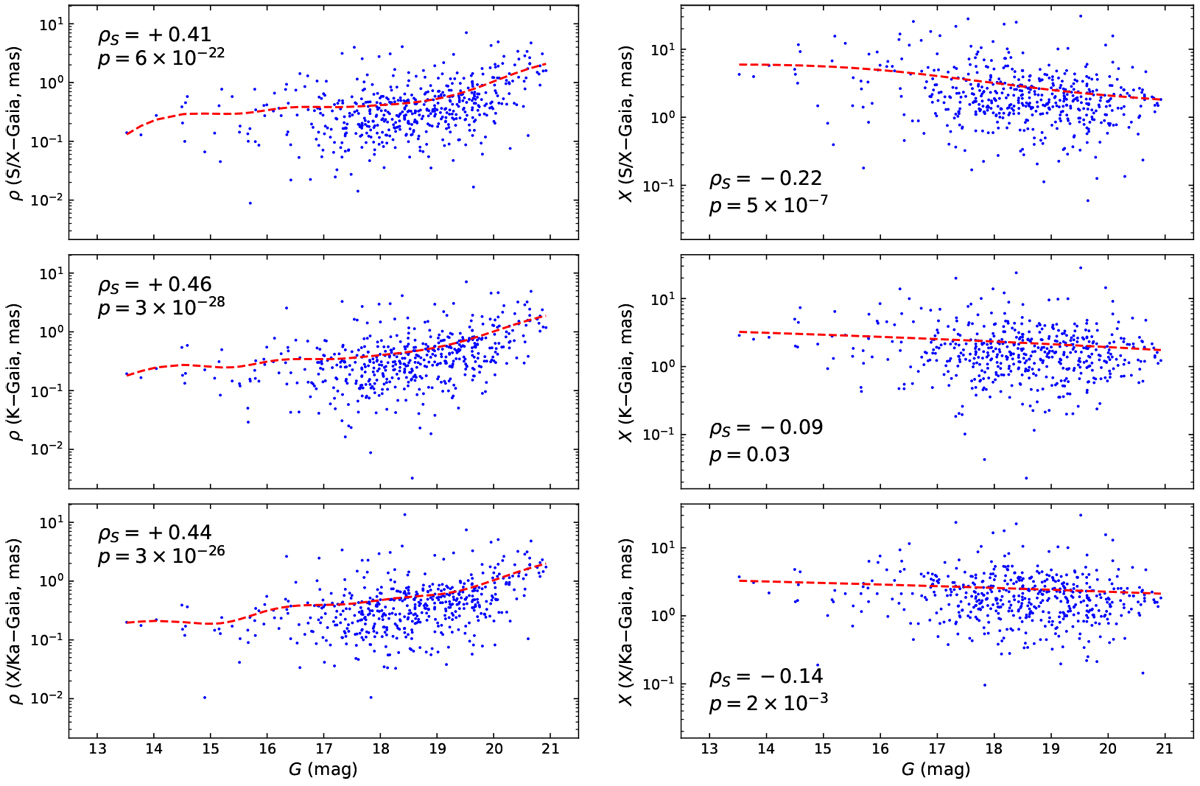
Optical-to-radio offsets (left) and normalized separations (right) at S∕X-, K-, and X∕Ka-band as a functionof the Gaia G magnitude for the 512 sources in our sample. The dashed red line indicates the Nadaraya-Waston estimator for the relation between the optical-to-radio offsets and the G magnitude.
Current usage metrics show cumulative count of Article Views (full-text article views including HTML views, PDF and ePub downloads, according to the available data) and Abstracts Views on Vision4Press platform.
Data correspond to usage on the plateform after 2015. The current usage metrics is available 48-96 hours after online publication and is updated daily on week days.
Initial download of the metrics may take a while.