Fig. 2
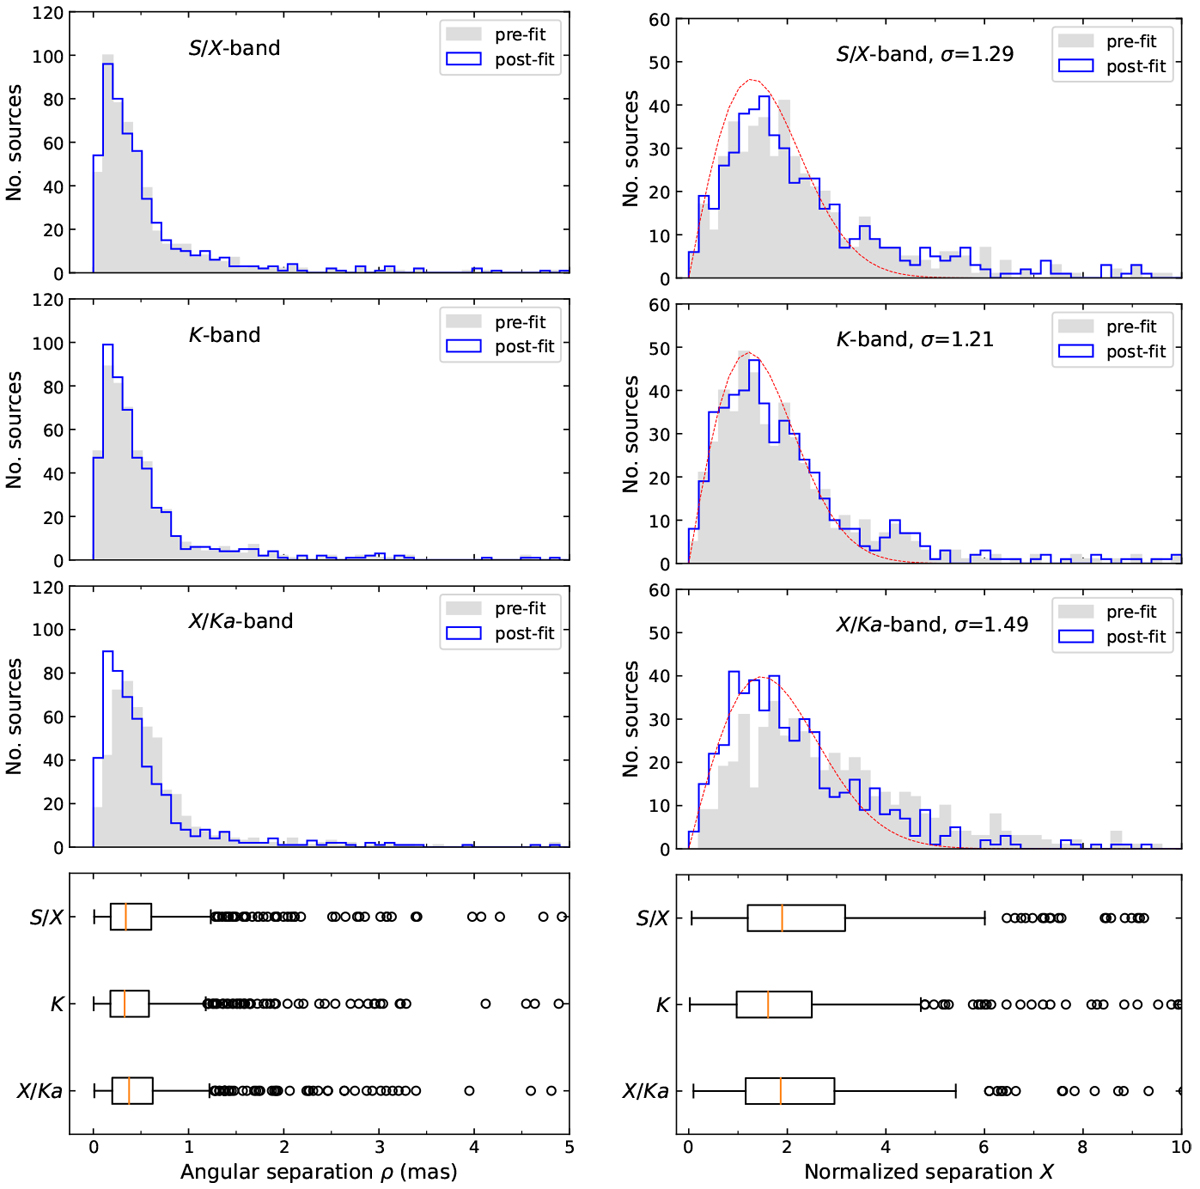
Distributions of optical-to-radio offset ρ (left) and normalized separation X (right) at S∕X-, K-, and X∕Ka-band for the 512 sources in common. The distribution is given for two cases, before (pre-fit in gray) and after (post-fit in blue) applying the VSH transformation. The left and right ends of the box in the boxplot indicate the 25th and 75th percentiles (labeled Q1 and Q3), respectively, and the orange line within the box shows the location of the median value. The ends of the whisker onthe left and right sides show the lower and upper limits of the bulk of the sample, which are Q0 = Q1− 1.5 ×IQR and Q4 = Q3 + 1.5 ×IQR, where IQR = Q3 − Q1. Data points (open circle) greater than Q4 or smaller than Q0 are outliers suggested by the boxplot. There are 50, 53, and 49 such points for S∕X-, K-, and X∕Ka-band, respectively,based on the angular separation; there are 26, 35, and 42 such points based on normalized separation. There are 23 sources at S∕X-band, 8 at K-band, and 12 at X∕Ka-band with X > 10 that are beyond the axis. The dashed red lines in the first three plots on the right represent the Rayleigh distributions with the sigma to be best fit to the sample of sources with X < X0, where X0 = 3.53 (Sect. 4).
Current usage metrics show cumulative count of Article Views (full-text article views including HTML views, PDF and ePub downloads, according to the available data) and Abstracts Views on Vision4Press platform.
Data correspond to usage on the plateform after 2015. The current usage metrics is available 48-96 hours after online publication and is updated daily on week days.
Initial download of the metrics may take a while.