Fig. 5.
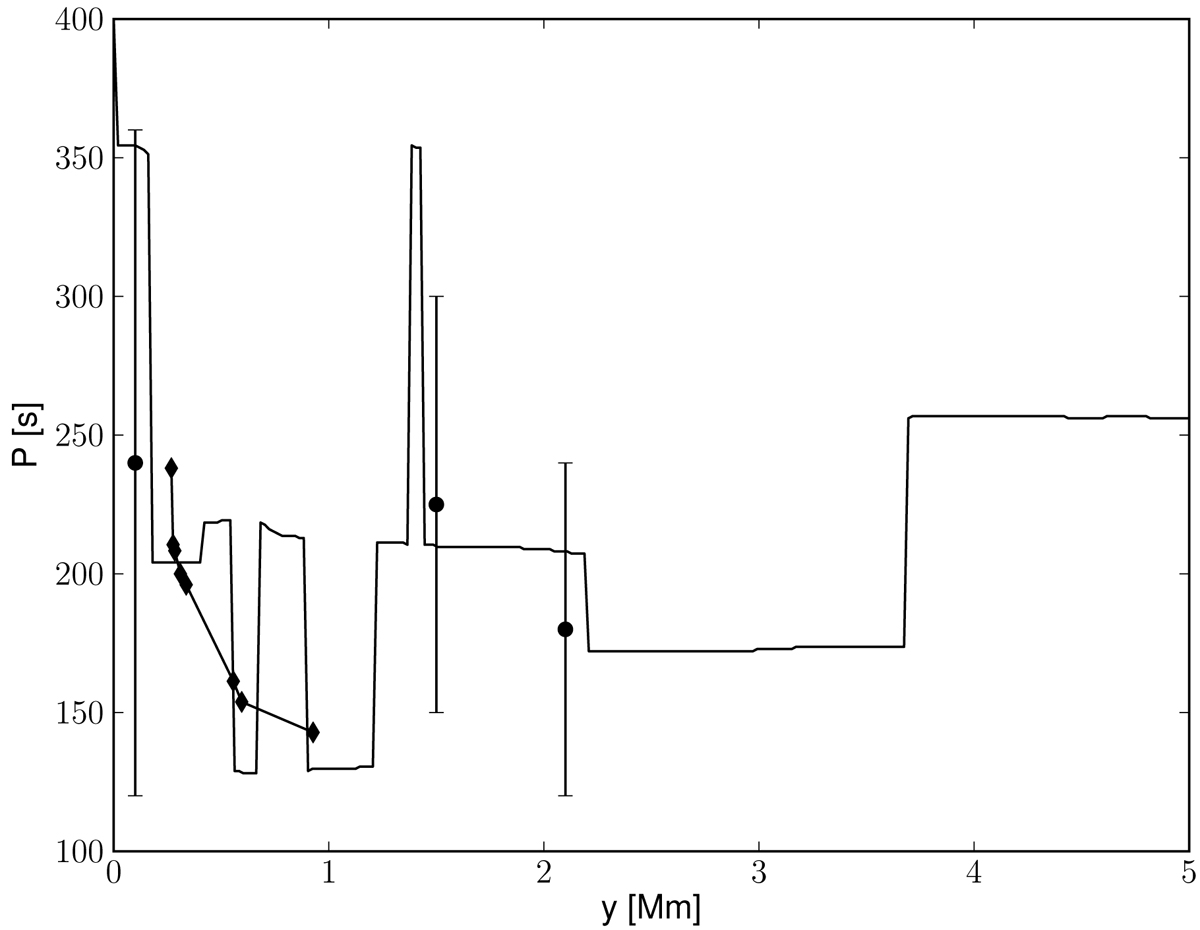
Main wave-periods evaluated from Fourier power spectrum for the numerically obtained Vi y(x = 0, y, t) (solid black line) vs height. The diamonds and dots show the observational data by Wiśniewska et al. (2016) and Kayshap et al. (2018), respectively. The error bars for the dots represent the range of periods detected by these observations at three given heights.
Current usage metrics show cumulative count of Article Views (full-text article views including HTML views, PDF and ePub downloads, according to the available data) and Abstracts Views on Vision4Press platform.
Data correspond to usage on the plateform after 2015. The current usage metrics is available 48-96 hours after online publication and is updated daily on week days.
Initial download of the metrics may take a while.