Fig. E.1.
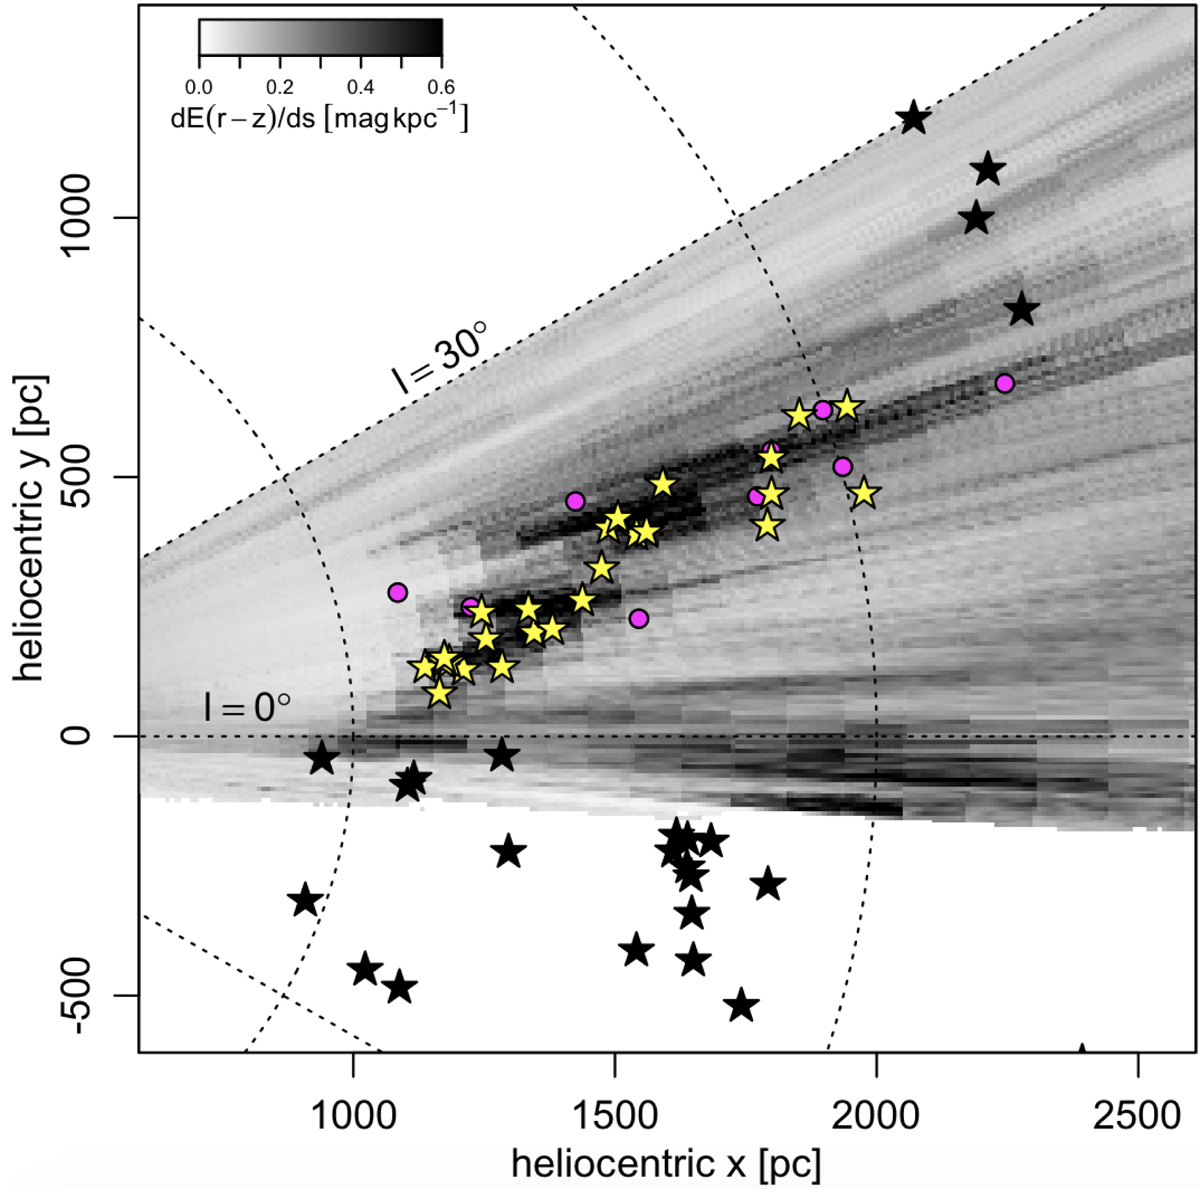
YSO groups and masers (same symbols as Fig. 3) overplotted on the 3D dust reddening map from Green et al. (2019), integrated from z = −300 pc to 300 pc. The YSO groups follow a dust feature in the reddening map with a similar pitch angle. The dust map is truncated by the limits of the Pan-STARRS survey (bottom edge) and by our |ℓ| < 30° limits in this Letter (top edge).
Current usage metrics show cumulative count of Article Views (full-text article views including HTML views, PDF and ePub downloads, according to the available data) and Abstracts Views on Vision4Press platform.
Data correspond to usage on the plateform after 2015. The current usage metrics is available 48-96 hours after online publication and is updated daily on week days.
Initial download of the metrics may take a while.