Fig. B.1.
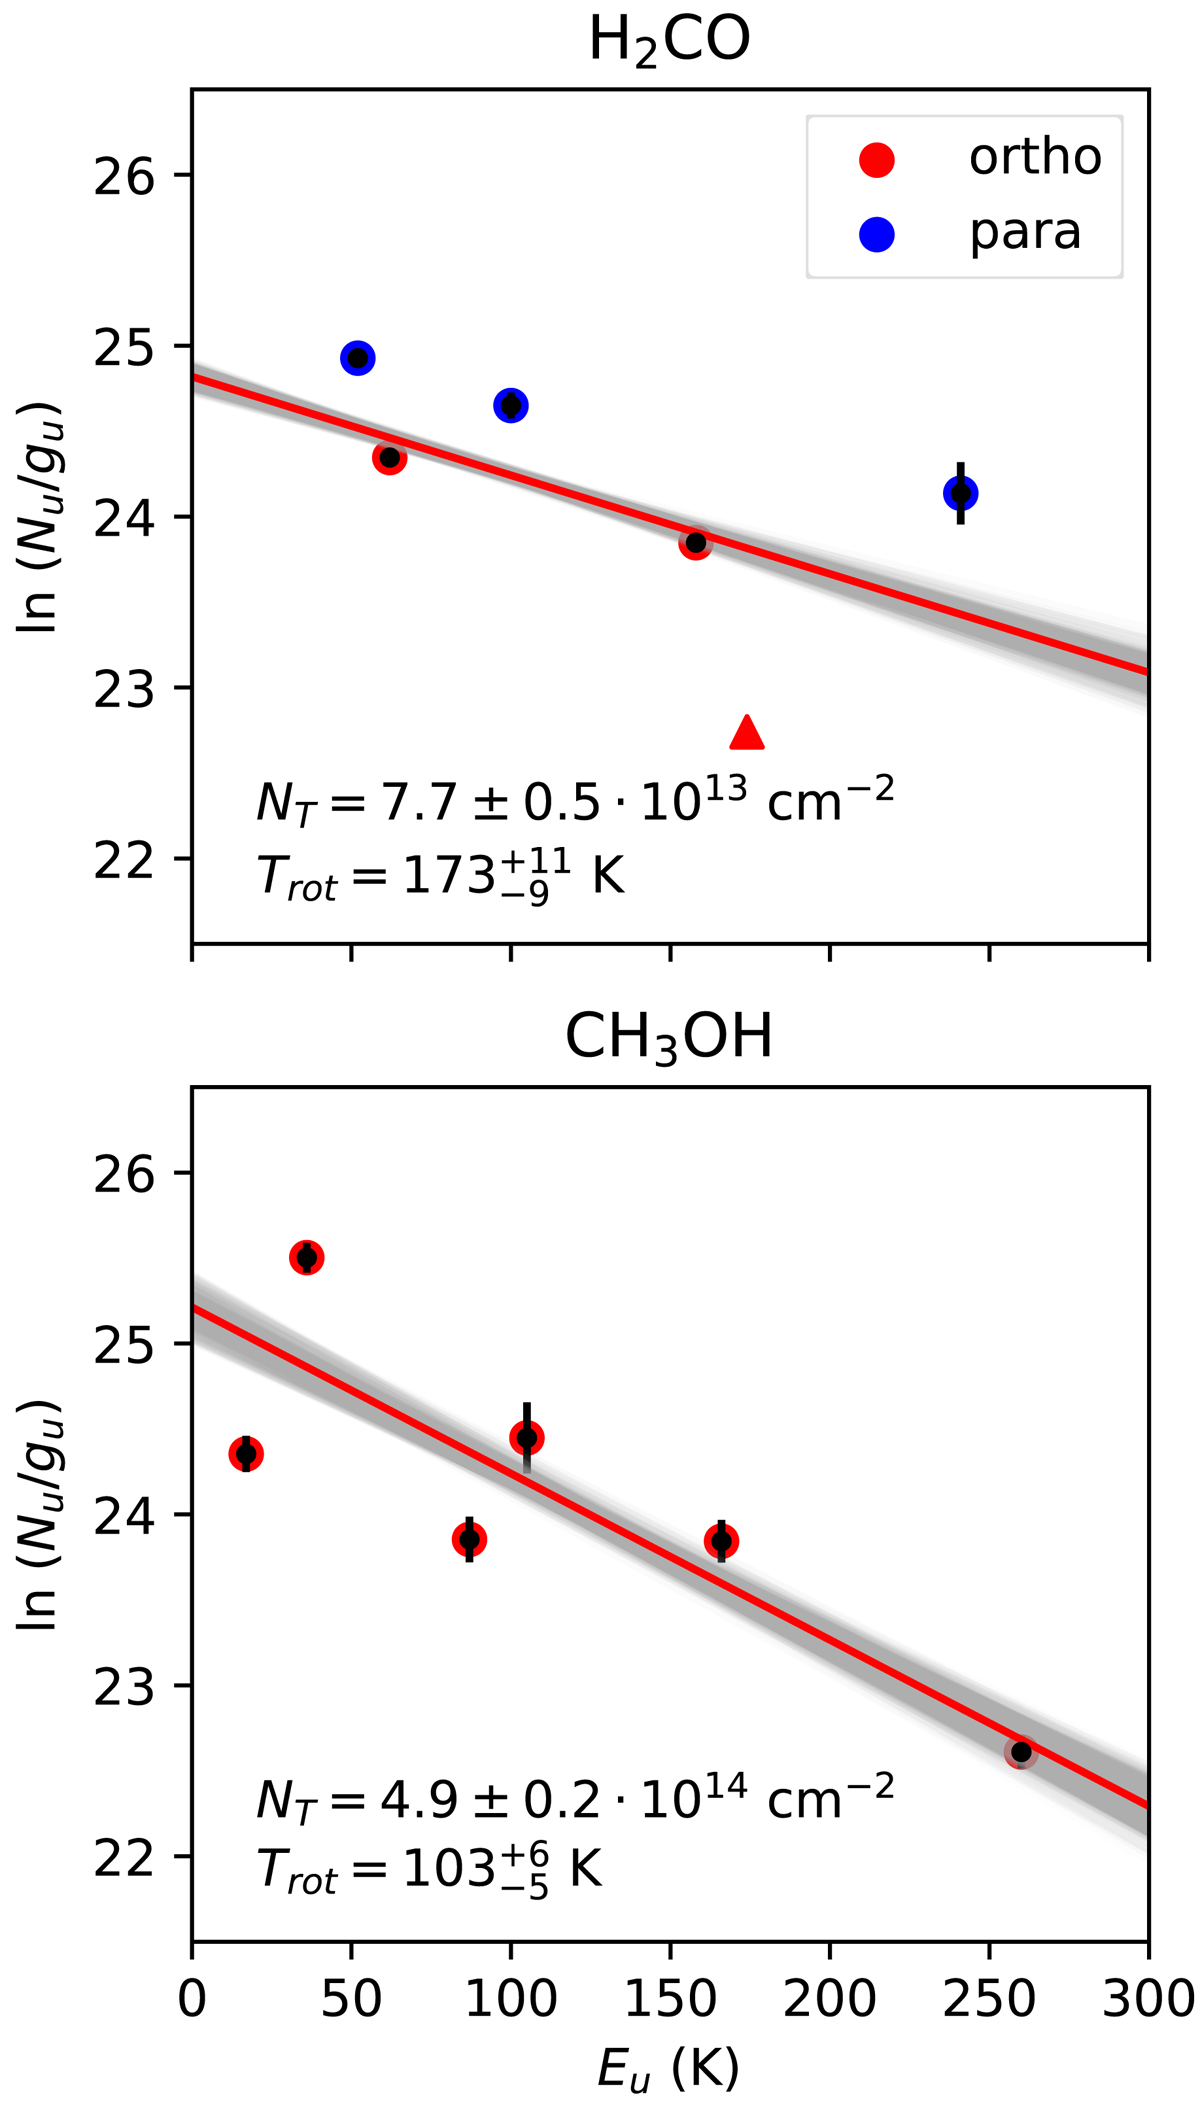
Rotational diagrams of H2CO and CH3OH using the integrated fluxes from this study and assuming optically thin emission. The integrated flux of the H2CO 91, 8 − 81, 7 transition from van der Marel et al. (2014) is included as a lower limit. The red line provides the best fit through the data points, and the grey lines are drawn from the posterior distribution from the fitting (Fig. B.2).
Current usage metrics show cumulative count of Article Views (full-text article views including HTML views, PDF and ePub downloads, according to the available data) and Abstracts Views on Vision4Press platform.
Data correspond to usage on the plateform after 2015. The current usage metrics is available 48-96 hours after online publication and is updated daily on week days.
Initial download of the metrics may take a while.