Fig. A.3.
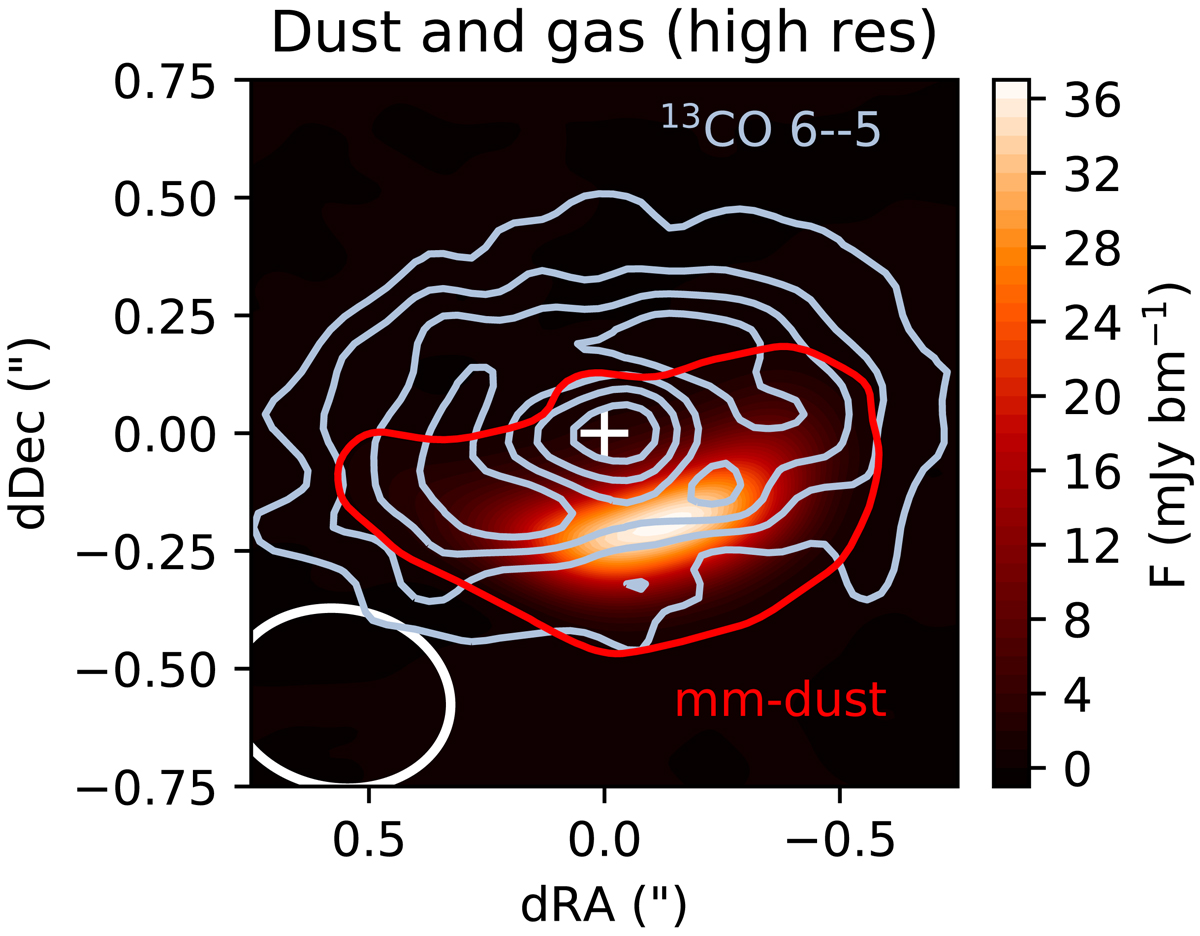
High-resolution image of the 13CO 6–5 zero-moment map (blue) and the 366 GHz continuum (red) at the original 0.18 × 0.14″ resolution. The contours of the 13CO show the 20%, 40%, 60%, and 80% of the peak, while the contours of the continuum indicate the 5σ level. This image demonstrates that the gas traces a full disk ring, whereas the millimetre dust grains are concentrated in the southern part of the disk.
Current usage metrics show cumulative count of Article Views (full-text article views including HTML views, PDF and ePub downloads, according to the available data) and Abstracts Views on Vision4Press platform.
Data correspond to usage on the plateform after 2015. The current usage metrics is available 48-96 hours after online publication and is updated daily on week days.
Initial download of the metrics may take a while.