Free Access
Fig. A.1.
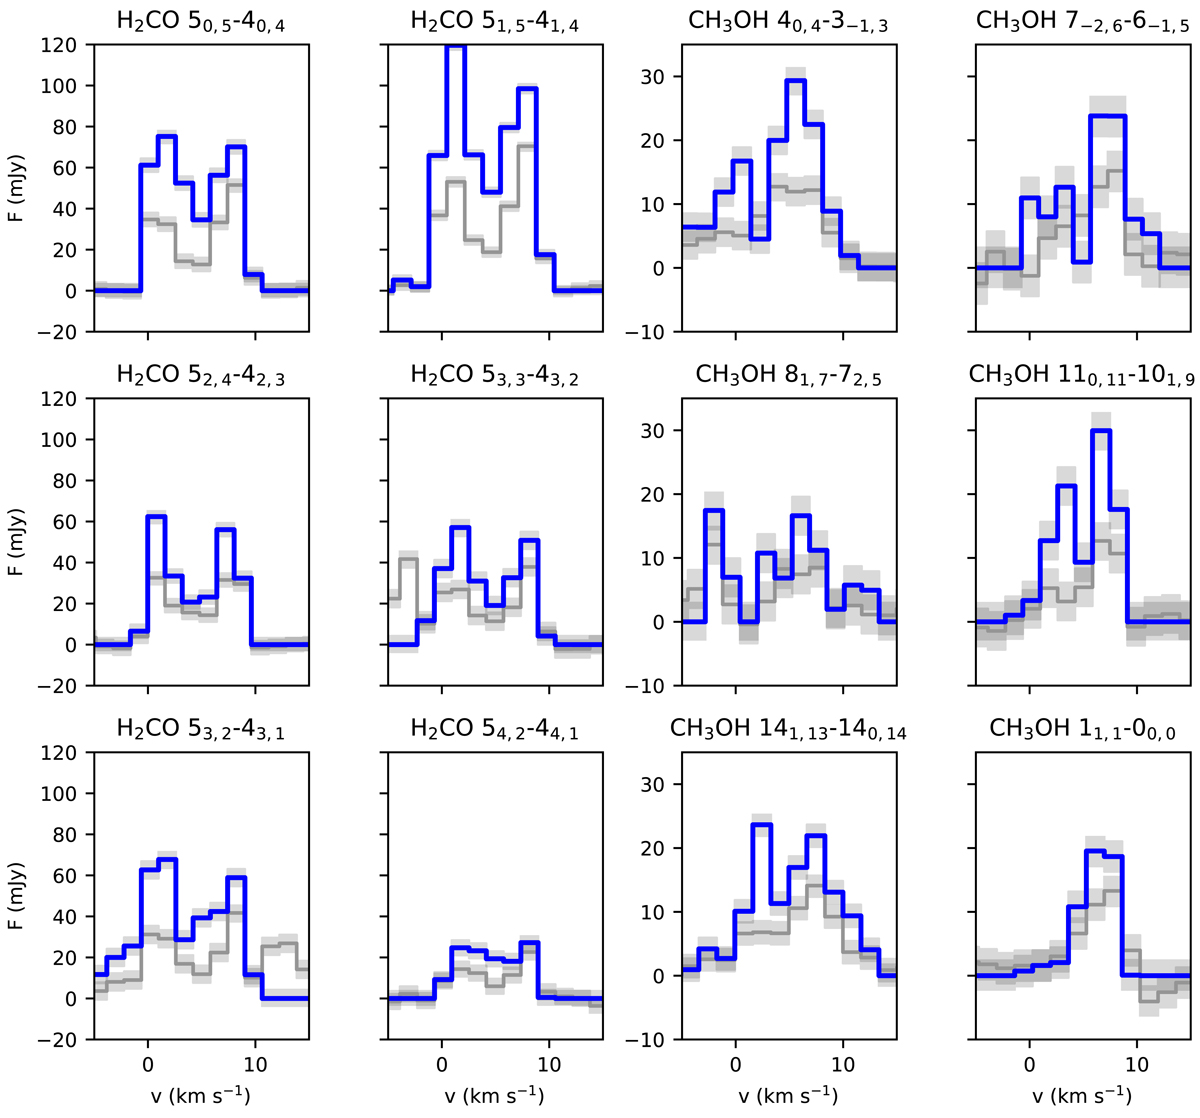
H2CO and CH3OH spectra, integrated over the central area of the dust trap using Keplerian masking (blue) and extracted from a rectangular box (grey). The grey shades indicate the noise levels in the spectra. The spectra are ordered by increasing Eu, following the values reported in Table 1.
Current usage metrics show cumulative count of Article Views (full-text article views including HTML views, PDF and ePub downloads, according to the available data) and Abstracts Views on Vision4Press platform.
Data correspond to usage on the plateform after 2015. The current usage metrics is available 48-96 hours after online publication and is updated daily on week days.
Initial download of the metrics may take a while.