Fig. 3.
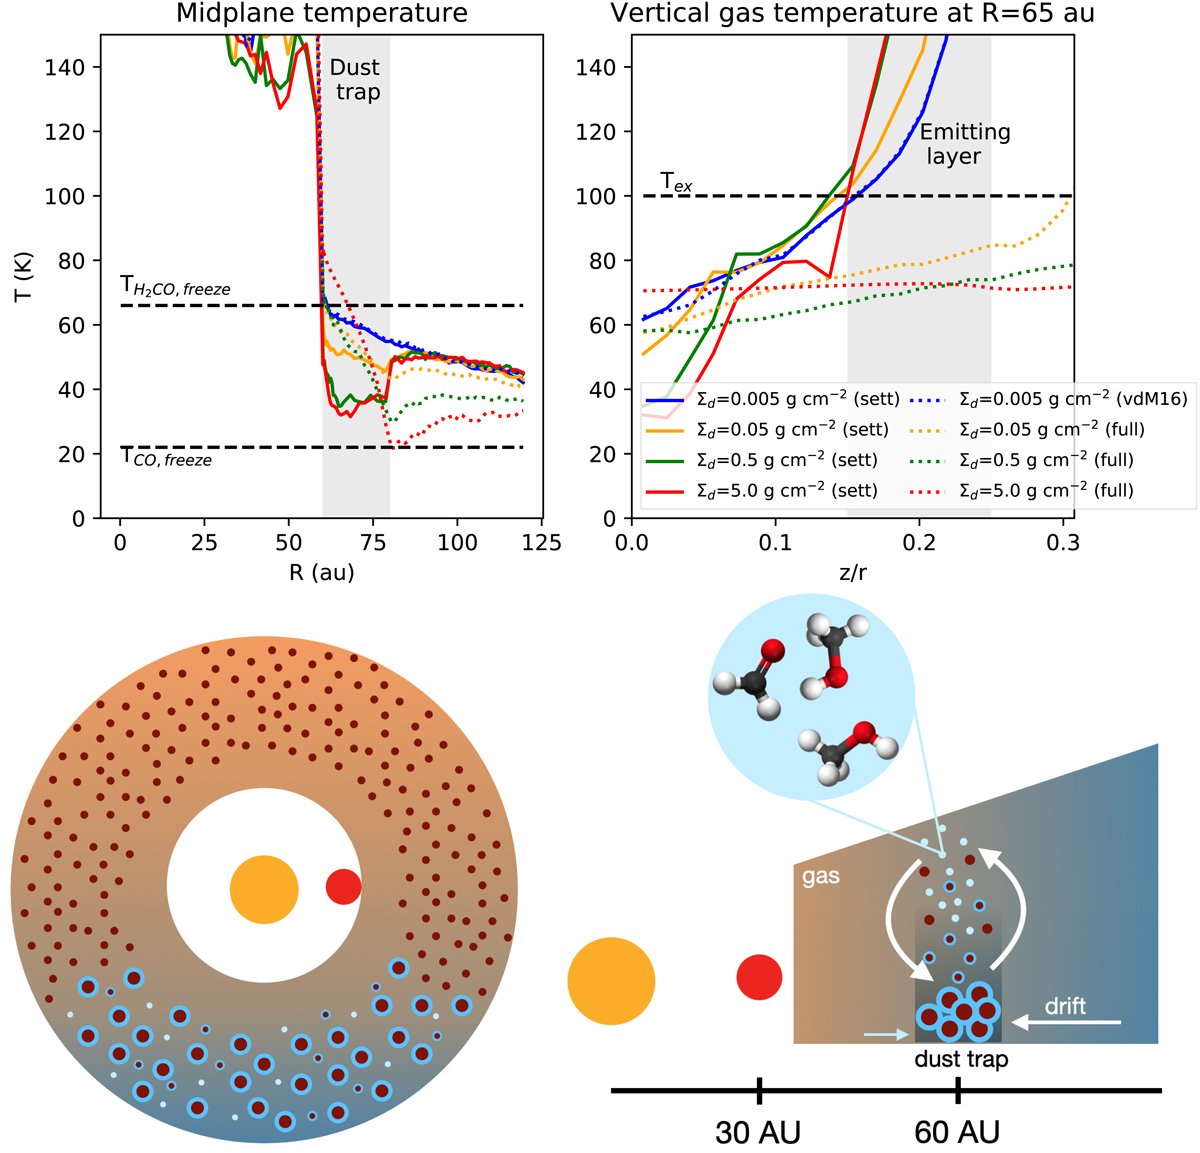
Temperature structure and proposed scenario for the release of the COMs in the dust trap. Top left: radial dust temperature profiles of the midplane. Top right: vertical gas temperature profiles at 65 au, just inside the dust trap. Both temperature profiles are based on our physical-chemical DALI models, with different dust surface densities (Figs. C.1 and C.2). In the midplane, the gas temperature is equal to the dust temperature. The plots demonstrate that the dust trap provides sufficiently low temperatures for a COM ice reservoir in the settled midplane, whereas the temperatures in the emitting layer are sufficiently high to explain the derived excitation temperatures. Bottom: sketch of the proposed scenario for the complex organic chemistry in a dust trap based on this work. The blue-orange gradient indicates the predicted temperature structure in the disk, the large arrows the vertical and radial transport of the icy pebbles, and the small arrow the thermal desorption at the inner edge of the dust trap.
Current usage metrics show cumulative count of Article Views (full-text article views including HTML views, PDF and ePub downloads, according to the available data) and Abstracts Views on Vision4Press platform.
Data correspond to usage on the plateform after 2015. The current usage metrics is available 48-96 hours after online publication and is updated daily on week days.
Initial download of the metrics may take a while.