Fig. C.3.
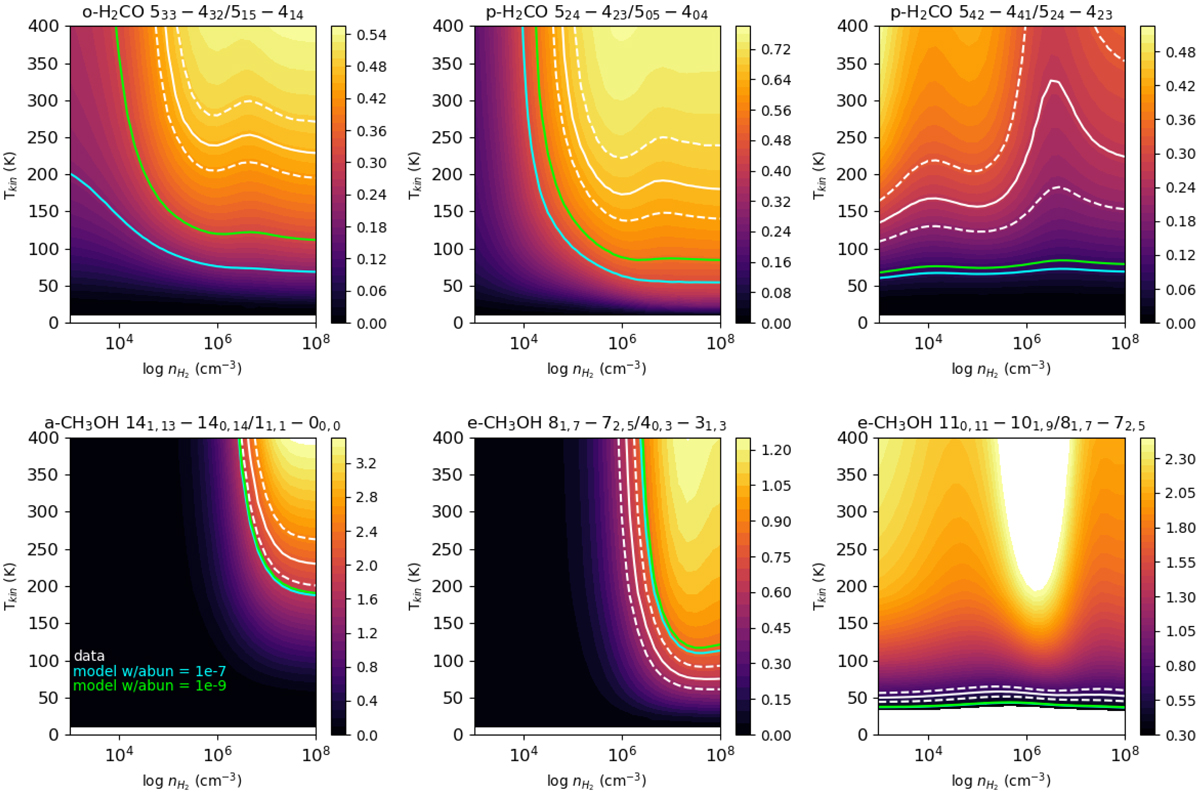
Expected line ratios as computed by RADEX for H2CO (top) and CH3OH (bottom) for a column density of 1014 cm−2. The white contours indicate the observed values and the dashed lines the uncertainty. The coloured lines indicate the ratios as computed for our DALI models of the settled model for fixed abundances of 10−7 and 10−9 in specific emitting layers, as described in the text.
Current usage metrics show cumulative count of Article Views (full-text article views including HTML views, PDF and ePub downloads, according to the available data) and Abstracts Views on Vision4Press platform.
Data correspond to usage on the plateform after 2015. The current usage metrics is available 48-96 hours after online publication and is updated daily on week days.
Initial download of the metrics may take a while.