Fig. C.2.
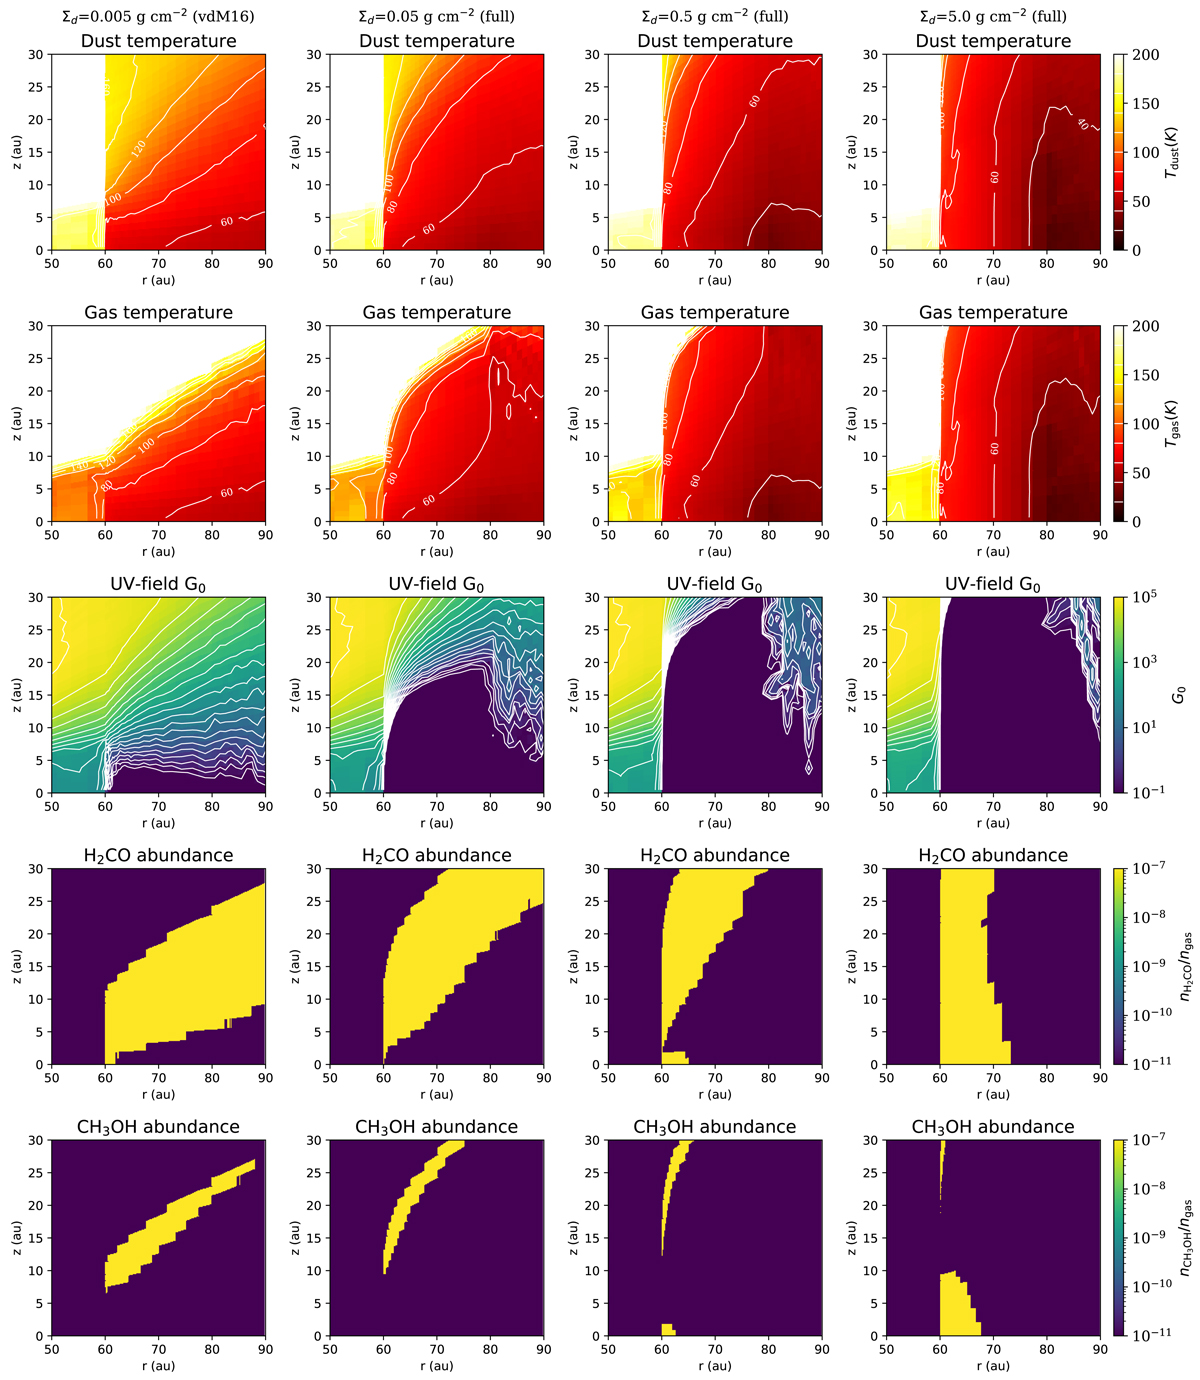
Temperature structure of the IRS 48 disk as computed by DALI, using the gas and dust density profile derived by van der Marel et al. (2016) for the full models (dust increase across the column). The columns show the influence of the assumed dust surface density (or dust-to-gas ratio, as the gas surface density is set constant) on the UV field and gas temperature. The white contours in the temperature plots indicate steps of 20 K.
Current usage metrics show cumulative count of Article Views (full-text article views including HTML views, PDF and ePub downloads, according to the available data) and Abstracts Views on Vision4Press platform.
Data correspond to usage on the plateform after 2015. The current usage metrics is available 48-96 hours after online publication and is updated daily on week days.
Initial download of the metrics may take a while.