Fig. 1.
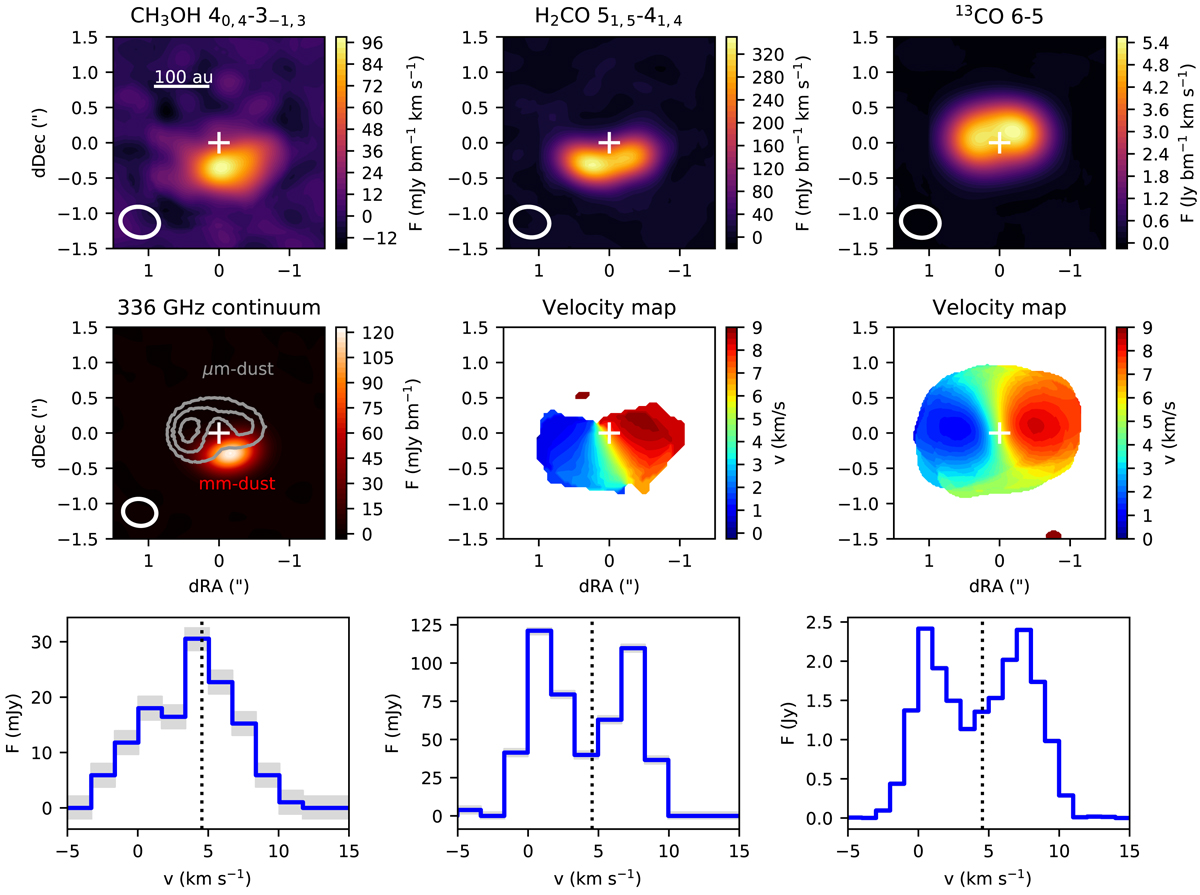
Overview of the brightest H2CO and CH3OH lines using Briggs weighting, the 336 GHz continuum, and the 13CO 6–5 map, with a similar beam size for comparison. Top row: zero-moment maps, middle row: continuum and first-moment maps, and bottom row: disk-integrated spectra. The micron-sized grain distribution as traced by 19 μm VISIR data (Geers et al. 2007) is indicated in the continuum image. The source velocity is indicated by a vertical dotted line. The grey shades indicate the noise levels in the spectra.
Current usage metrics show cumulative count of Article Views (full-text article views including HTML views, PDF and ePub downloads, according to the available data) and Abstracts Views on Vision4Press platform.
Data correspond to usage on the plateform after 2015. The current usage metrics is available 48-96 hours after online publication and is updated daily on week days.
Initial download of the metrics may take a while.