Fig. 4.
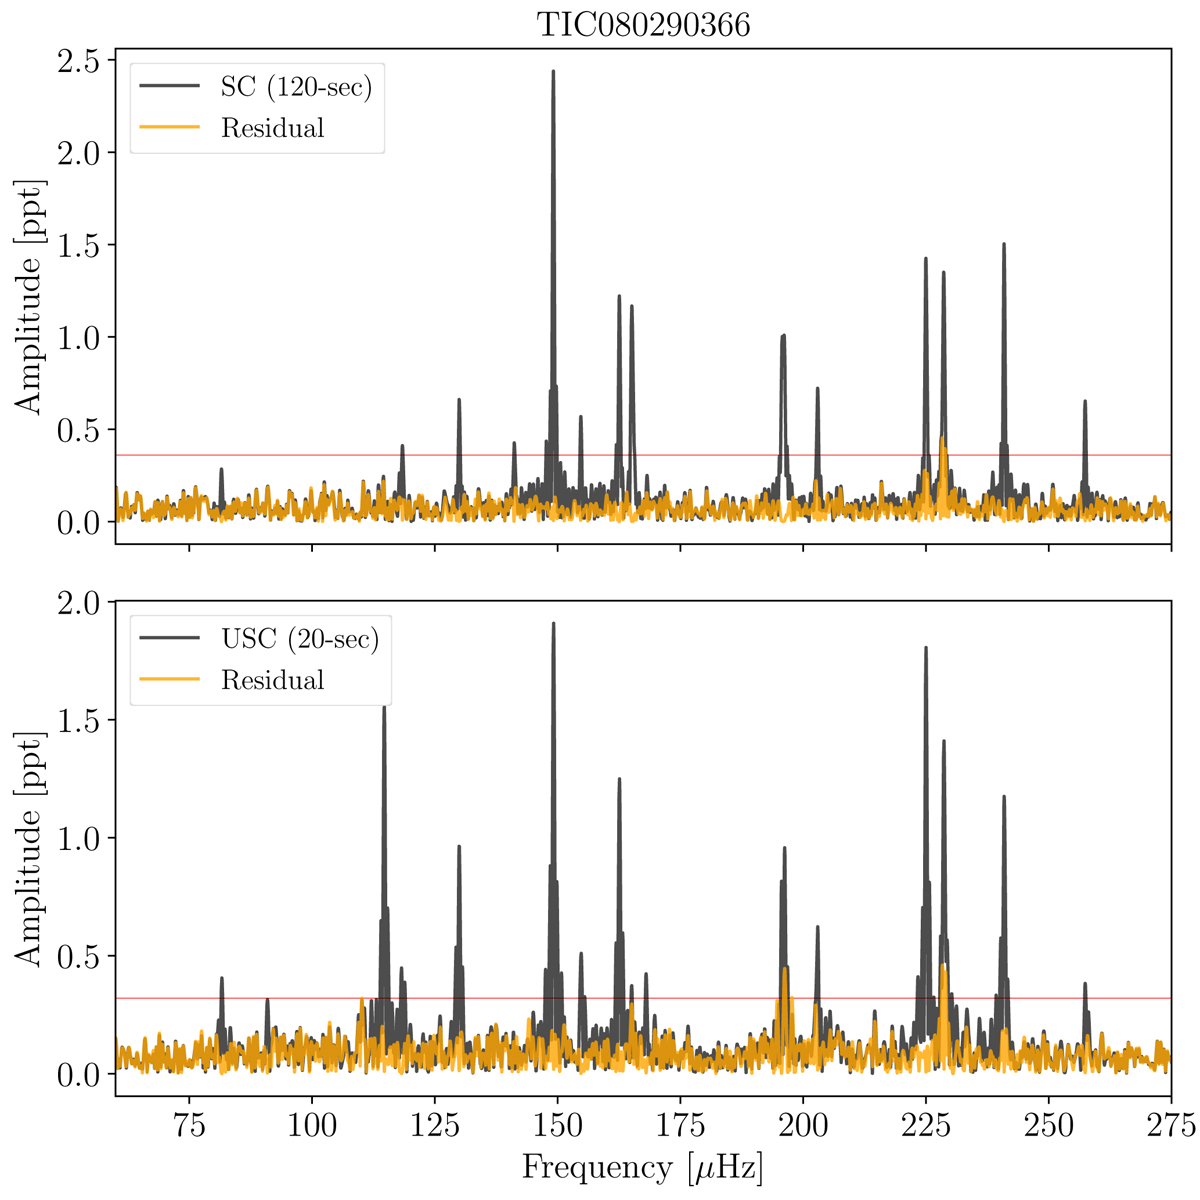
Top: Fourier transform of data taken in sector 2 of TIC 080290366. The horizontal red line indicates the 0.1% FAP level. The orange line is the residual after extraction of the signals. Bottom: Fourier transform of data taken in sector 29 of TIC 080290366. The horizontal red line indicates the 0.1% FAP level. The orange line is the FT of the prewhitened light curve.
Current usage metrics show cumulative count of Article Views (full-text article views including HTML views, PDF and ePub downloads, according to the available data) and Abstracts Views on Vision4Press platform.
Data correspond to usage on the plateform after 2015. The current usage metrics is available 48-96 hours after online publication and is updated daily on week days.
Initial download of the metrics may take a while.