Fig. 19.
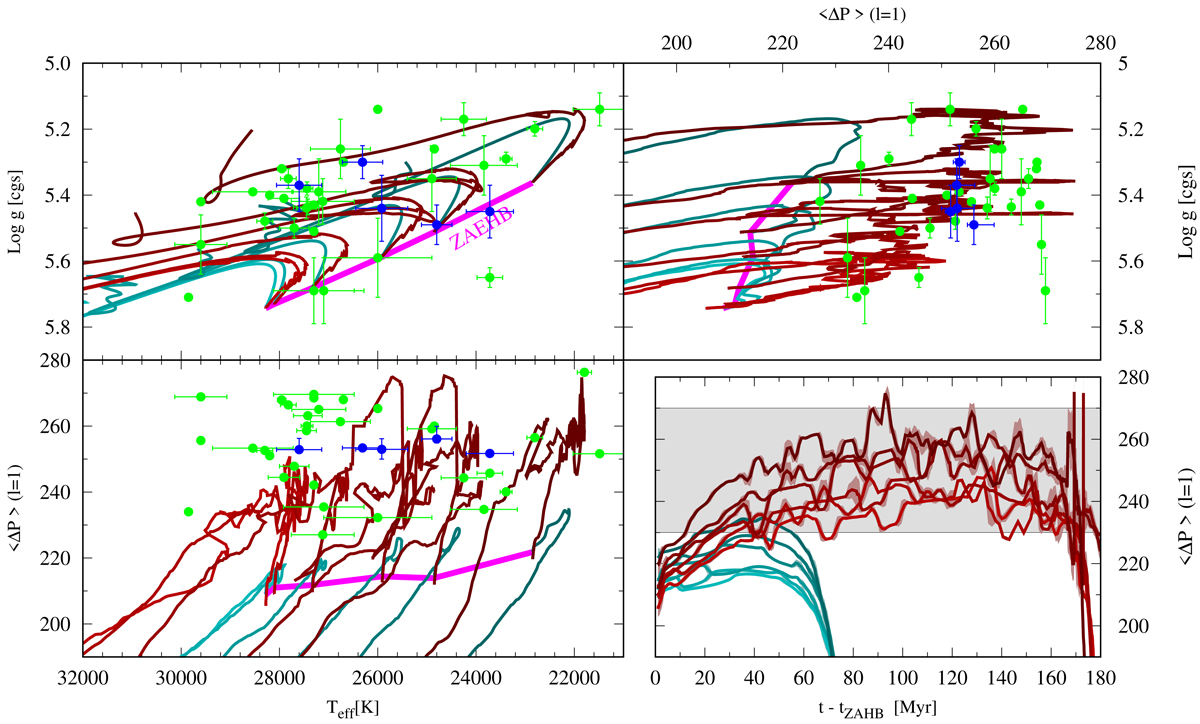
Properties of the two sets of stellar evolution models discussed in the text as compared with those observed in pulsating sdB stars. Blue circles indicate the stars studied in this work while green circles indicate those from previous studies (Reed et al. 2018; Charpinet et al. 2019; Reed et al. 2020a; Sahoo et al. 2020a). Red tracks correspond to models computed with a moderate CBM prescription while cyan tracks correspond to those computed under the extreme assumption of a strict Schwarzschild criterion. Masses of the models are MZAHB = 0.467, 0.4675, 0.468, and 0.47 M⊙, and darker colors correspond to more massive models. Thick magenta lines show the locus of the model at the zero-age extreme horizontal branch (ZAEHB). Light-colored bands around the curves in the bottom right panel indicate the typical variance of ΔP around the mean value.
Current usage metrics show cumulative count of Article Views (full-text article views including HTML views, PDF and ePub downloads, according to the available data) and Abstracts Views on Vision4Press platform.
Data correspond to usage on the plateform after 2015. The current usage metrics is available 48-96 hours after online publication and is updated daily on week days.
Initial download of the metrics may take a while.