Free Access
Fig. 18.
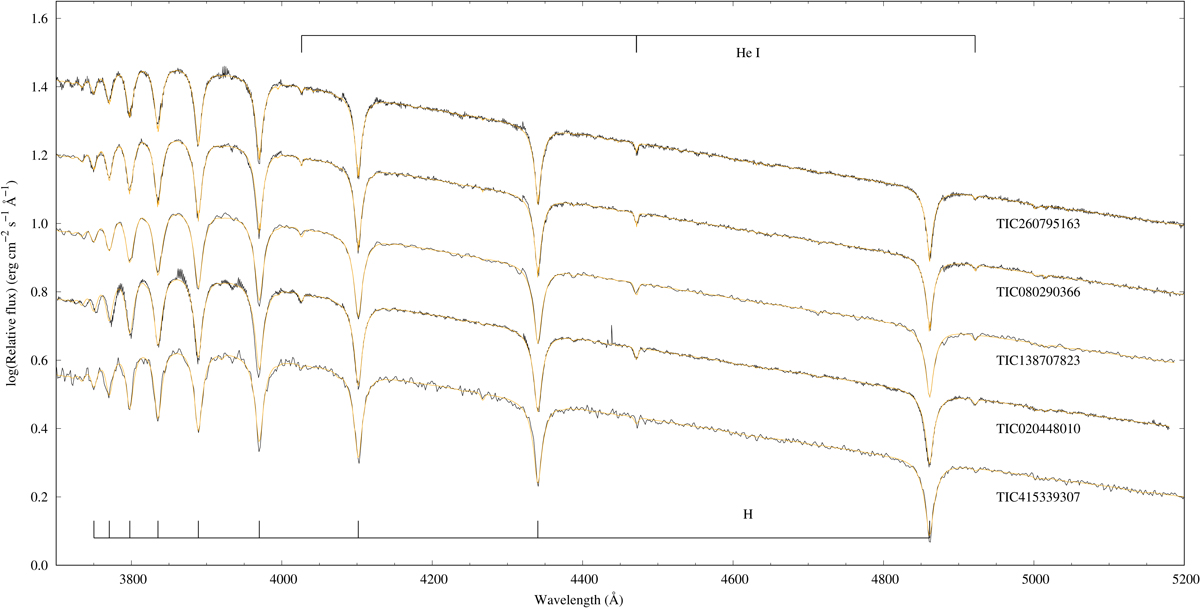
Best-fit TLUSTY/XTGRID models for the five hot subdwarf stars analyzed in this paper. The spectra are dominated by the H Balmer-series marked at the bottom and a few weak He I lines marked at the top of the figure. The observed continua adjusted to the theoretical models.
Current usage metrics show cumulative count of Article Views (full-text article views including HTML views, PDF and ePub downloads, according to the available data) and Abstracts Views on Vision4Press platform.
Data correspond to usage on the plateform after 2015. The current usage metrics is available 48-96 hours after online publication and is updated daily on week days.
Initial download of the metrics may take a while.