Fig. 13.
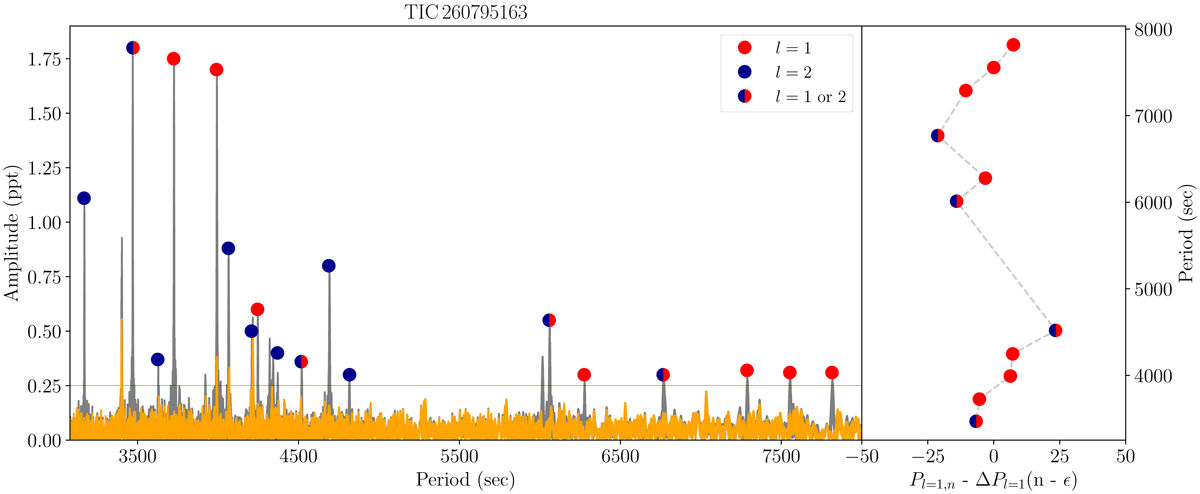
Fourier transform of TIC 260795163 (presented here are the sectors 1, 28 and 29 together). The residuals after prewhitening are shown in orange. The red and blue dots show the dipole and quadrupole modes respectively. If there is no unique identification, the period is shown in both colors. The horizontal red line correspond to 0.1% FAP confidence level. The right panel shows the residuals between the observed and the fitted periods. See text for more details on mode identification and the mean period spacing computations.
Current usage metrics show cumulative count of Article Views (full-text article views including HTML views, PDF and ePub downloads, according to the available data) and Abstracts Views on Vision4Press platform.
Data correspond to usage on the plateform after 2015. The current usage metrics is available 48-96 hours after online publication and is updated daily on week days.
Initial download of the metrics may take a while.