Fig. 5
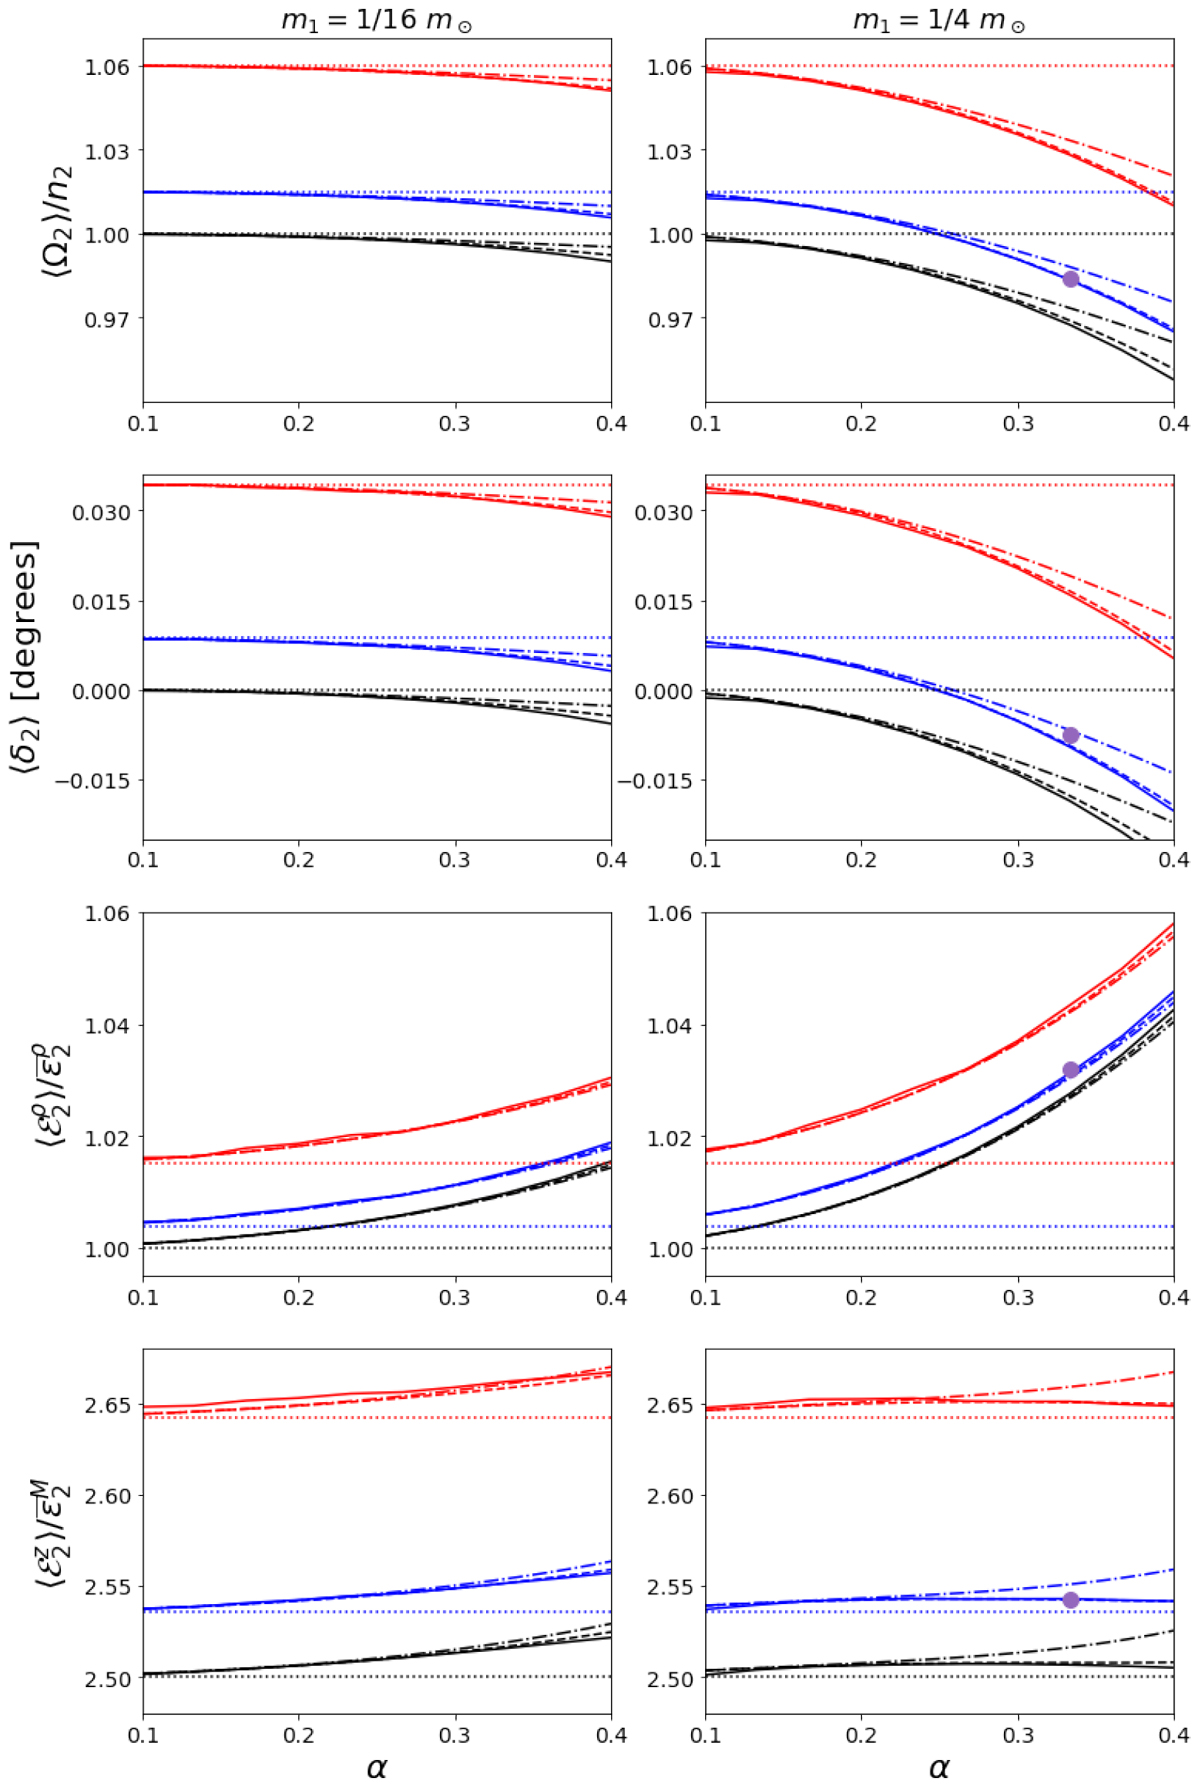
Mean rotational speed ⟨Ω2⟩ (first row panels), mean lag-angle ⟨δ2⟩ (second row panels), mean equatorial flattening ![]() (third row panels) and mean polar flattening
(third row panels) and mean polar flattening ![]() (last row panels) as a function of the semimajor axis ratio α = a1∕a2, for the case γ2 = 100n2. The initial conditions for the system were taken from Table 1, but considering different planetary eccentricities, shown with curves of different colours (same colour convention as in Fig. 4), and different secondary mass:
m1 = 1∕16 m⊙
(first column) and m1 = 1∕4 m⊙
(second column). Different types of curves represent different methods for obtaining the mean values with the same convention as in Fig. 4 but including the fourth-order fit shown with a dot-dashed line. The magenta dots in the right panels represent the final mean value obtained for this relaxation factor from the simulations of Fig. 3.
(last row panels) as a function of the semimajor axis ratio α = a1∕a2, for the case γ2 = 100n2. The initial conditions for the system were taken from Table 1, but considering different planetary eccentricities, shown with curves of different colours (same colour convention as in Fig. 4), and different secondary mass:
m1 = 1∕16 m⊙
(first column) and m1 = 1∕4 m⊙
(second column). Different types of curves represent different methods for obtaining the mean values with the same convention as in Fig. 4 but including the fourth-order fit shown with a dot-dashed line. The magenta dots in the right panels represent the final mean value obtained for this relaxation factor from the simulations of Fig. 3.
Current usage metrics show cumulative count of Article Views (full-text article views including HTML views, PDF and ePub downloads, according to the available data) and Abstracts Views on Vision4Press platform.
Data correspond to usage on the plateform after 2015. The current usage metrics is available 48-96 hours after online publication and is updated daily on week days.
Initial download of the metrics may take a while.