Fig. 4
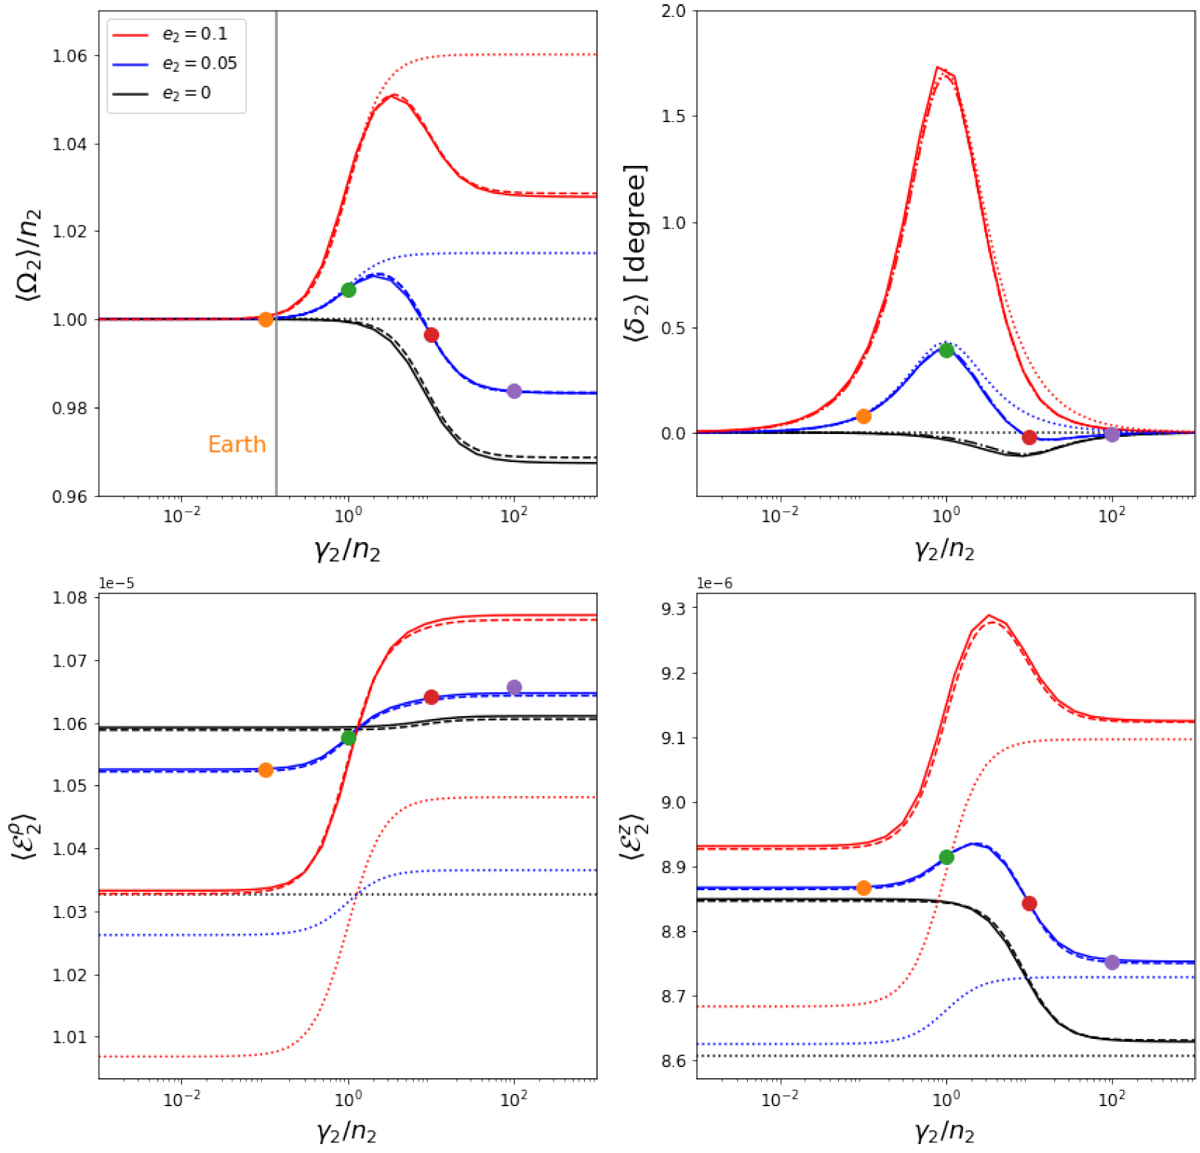
Mean rotational speed ⟨Ω2⟩ (upper left panel), mean lag-angle ⟨δ2⟩ (upper right panel), mean equatorial flattening ![]() (lower left panel) and mean polar flattening
(lower left panel) and mean polar flattening ![]() (lower right panel) as a function of the planetary relaxation factor normalised by the mean motion frequency
γ2 ∕n2. The initial conditions for the system were taken from Table 1, but considering different planetary eccentricities, which are shown with curves of different colours as indicated in the upper left panel. Different types of curves represent different methods for obtaining the mean values: full-line curves represent the numerical results, dashed-line curves represent our sixth-order fit, and dotted-line curves represent the results of considering the 2BP with a central mass equal to the sum of the binary components. The vertical grey line in the upper left panel represents the position in the diagram of a solid Earth (Ferraz-Mello 2013) and the large coloured dots represent the final mean value obtained with different
γ2 values, from simulations of Fig. 3 captured in the 1:1 spin–orbit resonance:
γ2 ∕n2 = 0.1 (orange), γ2∕n2 = 1 (green), γ2∕n2 = 10 (red) and γ2∕n2 = 100 (magenta).
(lower right panel) as a function of the planetary relaxation factor normalised by the mean motion frequency
γ2 ∕n2. The initial conditions for the system were taken from Table 1, but considering different planetary eccentricities, which are shown with curves of different colours as indicated in the upper left panel. Different types of curves represent different methods for obtaining the mean values: full-line curves represent the numerical results, dashed-line curves represent our sixth-order fit, and dotted-line curves represent the results of considering the 2BP with a central mass equal to the sum of the binary components. The vertical grey line in the upper left panel represents the position in the diagram of a solid Earth (Ferraz-Mello 2013) and the large coloured dots represent the final mean value obtained with different
γ2 values, from simulations of Fig. 3 captured in the 1:1 spin–orbit resonance:
γ2 ∕n2 = 0.1 (orange), γ2∕n2 = 1 (green), γ2∕n2 = 10 (red) and γ2∕n2 = 100 (magenta).
Current usage metrics show cumulative count of Article Views (full-text article views including HTML views, PDF and ePub downloads, according to the available data) and Abstracts Views on Vision4Press platform.
Data correspond to usage on the plateform after 2015. The current usage metrics is available 48-96 hours after online publication and is updated daily on week days.
Initial download of the metrics may take a while.