Fig. 2
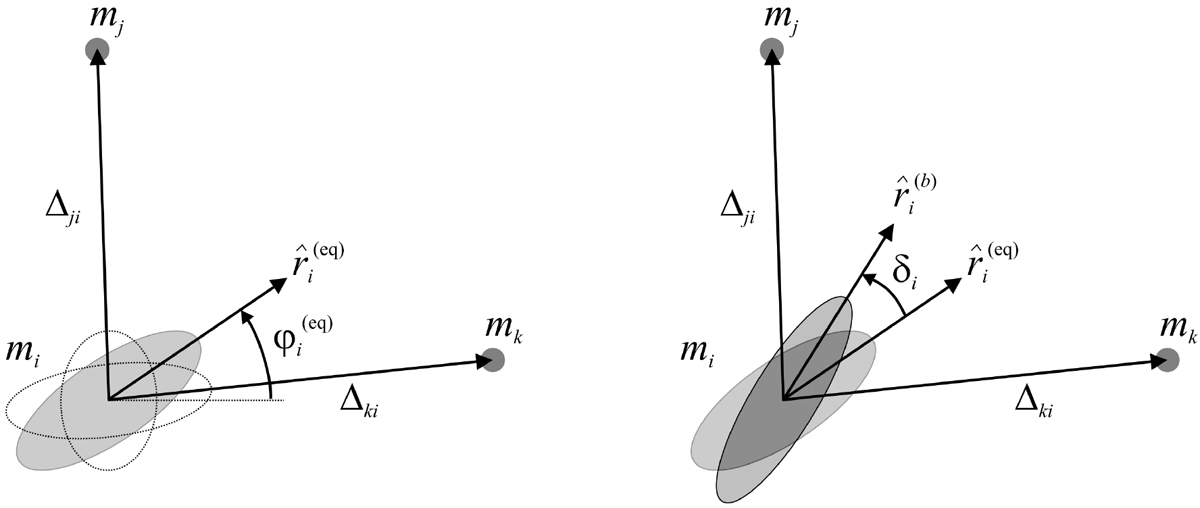
Left: equilibrium figure in the 3BP. Dashed-empty ellipsoids correspond to the static tidal deformations generated by each of the perturbing masses, while the resulting equilibrium figure of mi (Eq. (3)) is shown by a filled grey ellipsoid. The unit vector
![]() indicates the orientation of the equivalent equilibrium bulge. Right: real figure in the 3BP. The dark grey filled ellipsoid represents the modelled real figure induced on
mi when we take into account the internal viscosity; we note that it is displaced by an angle
δi, with respectto the equilibrium figure and also has different flattenings.
indicates the orientation of the equivalent equilibrium bulge. Right: real figure in the 3BP. The dark grey filled ellipsoid represents the modelled real figure induced on
mi when we take into account the internal viscosity; we note that it is displaced by an angle
δi, with respectto the equilibrium figure and also has different flattenings.
Current usage metrics show cumulative count of Article Views (full-text article views including HTML views, PDF and ePub downloads, according to the available data) and Abstracts Views on Vision4Press platform.
Data correspond to usage on the plateform after 2015. The current usage metrics is available 48-96 hours after online publication and is updated daily on week days.
Initial download of the metrics may take a while.