Fig. 8.
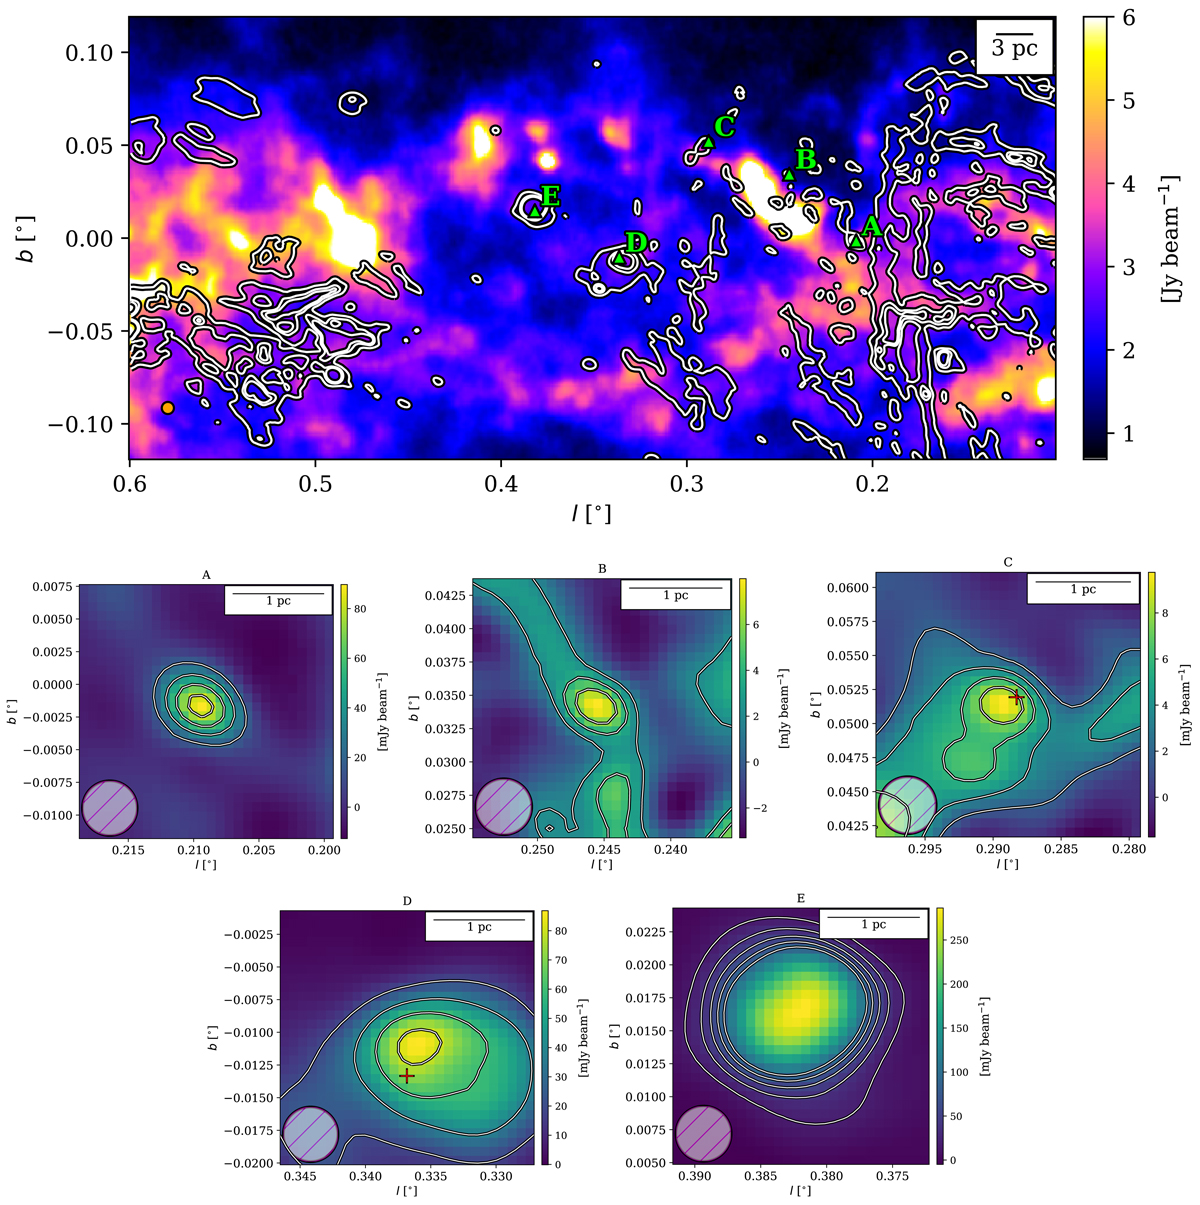
Maps of the dust ridge presented similar to Fig. 5 in Immer et al. (2012a). Top: ATLASGAL 870 μm dust emission towards the dust ridge with GLOSTAR 5.8 GHz radio continuum contours overlaid with contour levels of 2%, 8%, and 13% of the maximum. Bottom: GLOSTAR VLA cutouts of sources A-E cut to a larger angular size compared to Immer et al. (2012a). For sources A, D, and E, the contours are from 10σ to 50σ in steps of 10σ. For sources B and C, the contour levels are 4σ, 12σ, and 20σ. Red crosses denote the positions of YSOs.
Current usage metrics show cumulative count of Article Views (full-text article views including HTML views, PDF and ePub downloads, according to the available data) and Abstracts Views on Vision4Press platform.
Data correspond to usage on the plateform after 2015. The current usage metrics is available 48-96 hours after online publication and is updated daily on week days.
Initial download of the metrics may take a while.