Fig. 5.
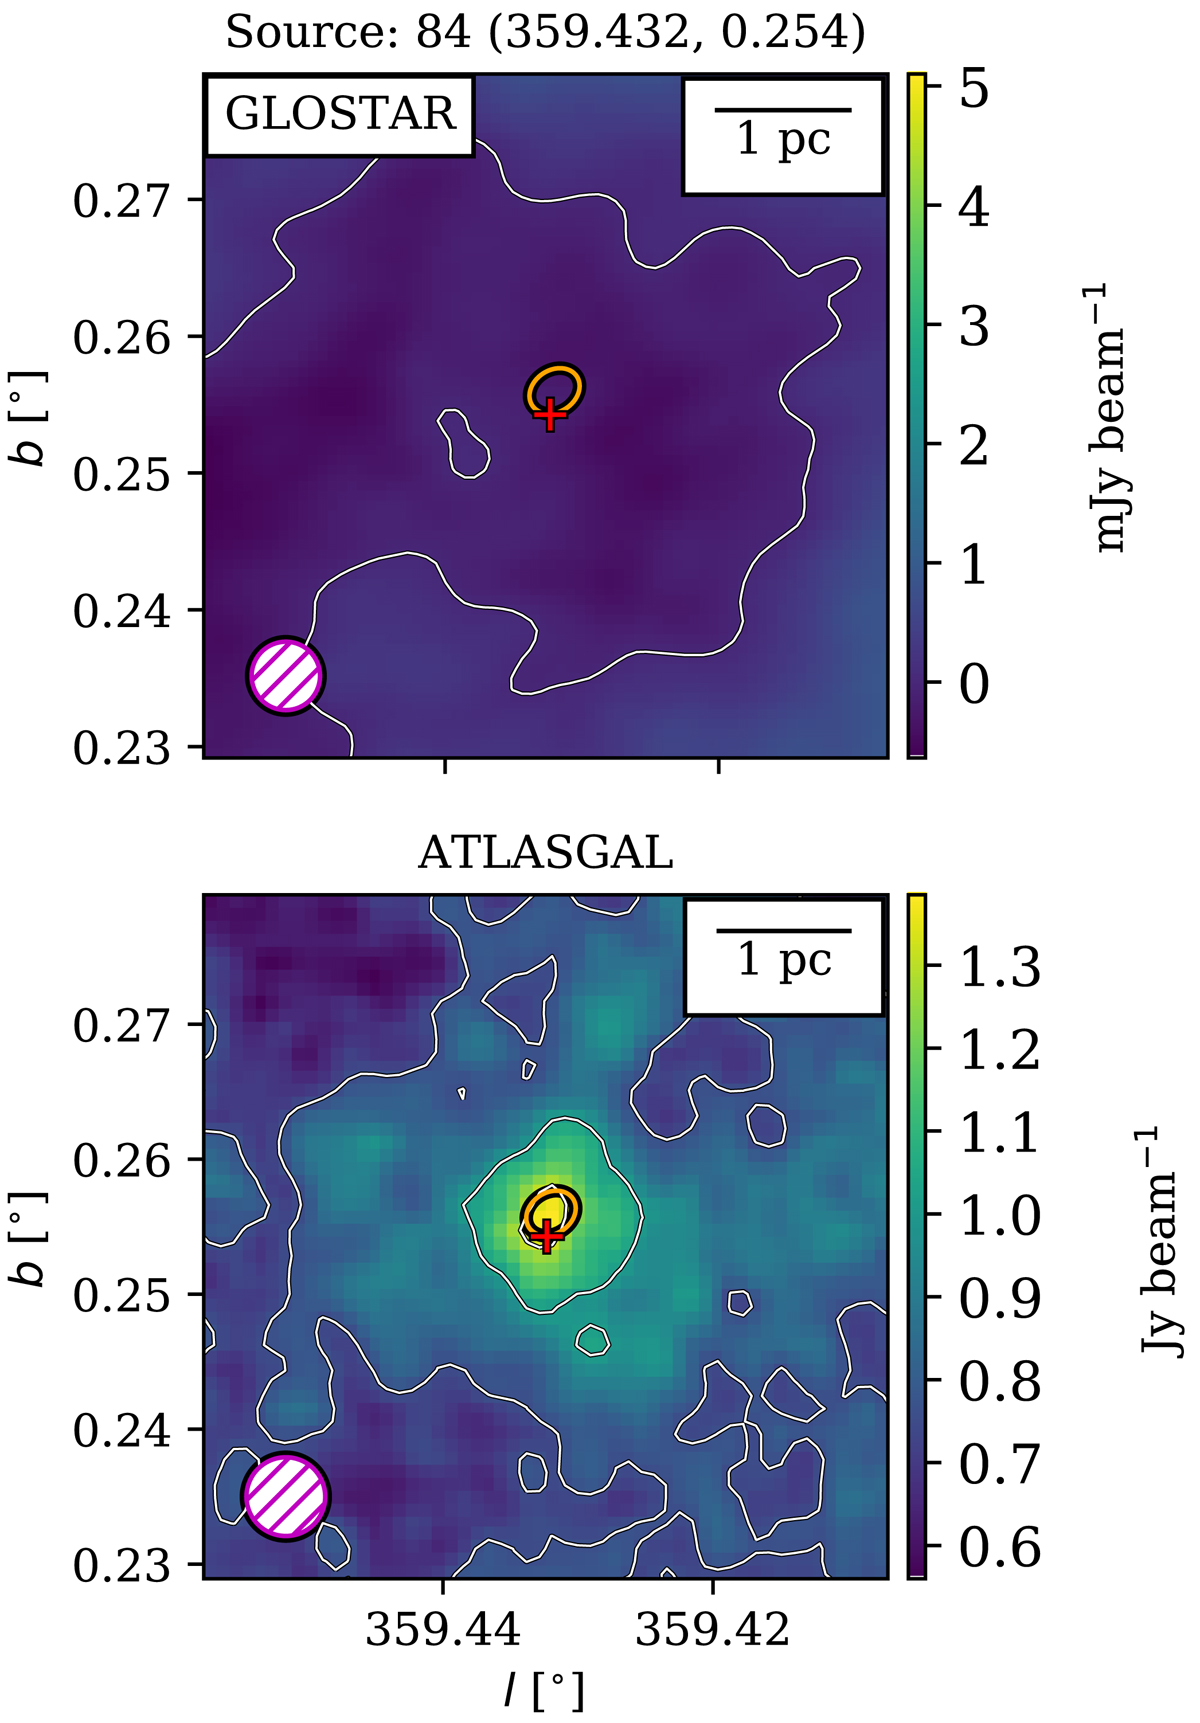
Non-detection of GLOSTAR 5.8 GHz emission and detection of ATLASGAL 870 μm emission towards source 84 from Nandakumar et al. (2018). Top: GLOSTAR 5.8 GHz radio continuum 3′ × 3′ zoom-in. A red cross denotes the location of the YSO, and the orange ellipse represents ATLASGAL sources from Contreras et al. (2013). The GLOSTAR beam size is shown in the bottom left corner. The white contour shows the 0.5 mJy beam−1 level, which is the average 5σ level for the GLOSTAR data. Bottom: ATLASGAL map, where the contours are dynamical contours (as formulated by Thompson et al. 2006).
Current usage metrics show cumulative count of Article Views (full-text article views including HTML views, PDF and ePub downloads, according to the available data) and Abstracts Views on Vision4Press platform.
Data correspond to usage on the plateform after 2015. The current usage metrics is available 48-96 hours after online publication and is updated daily on week days.
Initial download of the metrics may take a while.