Fig. 4.
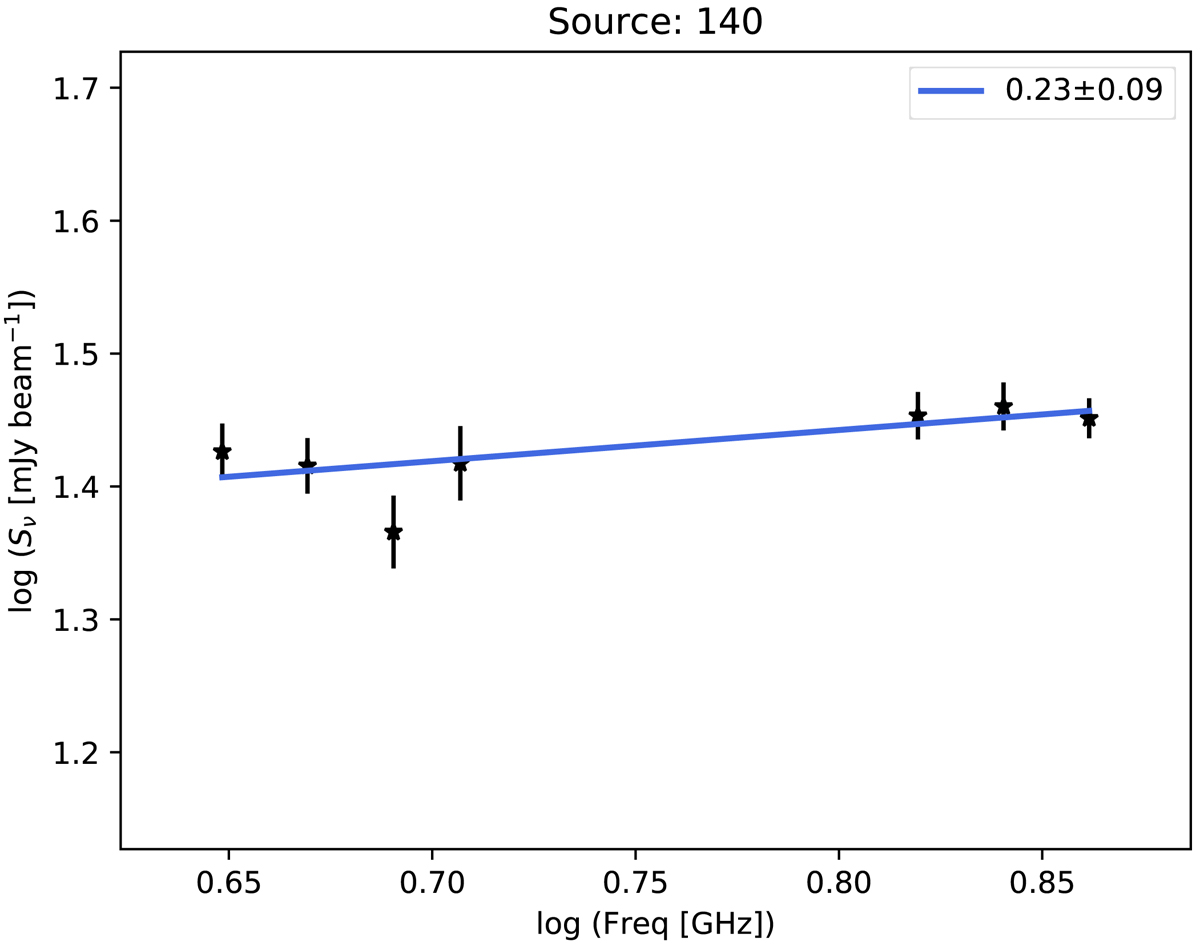
Determination of the spectral index for source 140 (G359.784+0.040). Only frequency bands that meet the minimum threshold of 3σ are considered. The solid blue line shows the best-fit model determined by the linear regression. The fitted spectral index is indicated in the upper right corner. The frequencies range from 4.45 GHz to 7.2 GHz. The spectral indices of the full sample are shown in Appendix C.
Current usage metrics show cumulative count of Article Views (full-text article views including HTML views, PDF and ePub downloads, according to the available data) and Abstracts Views on Vision4Press platform.
Data correspond to usage on the plateform after 2015. The current usage metrics is available 48-96 hours after online publication and is updated daily on week days.
Initial download of the metrics may take a while.