Fig. 3.
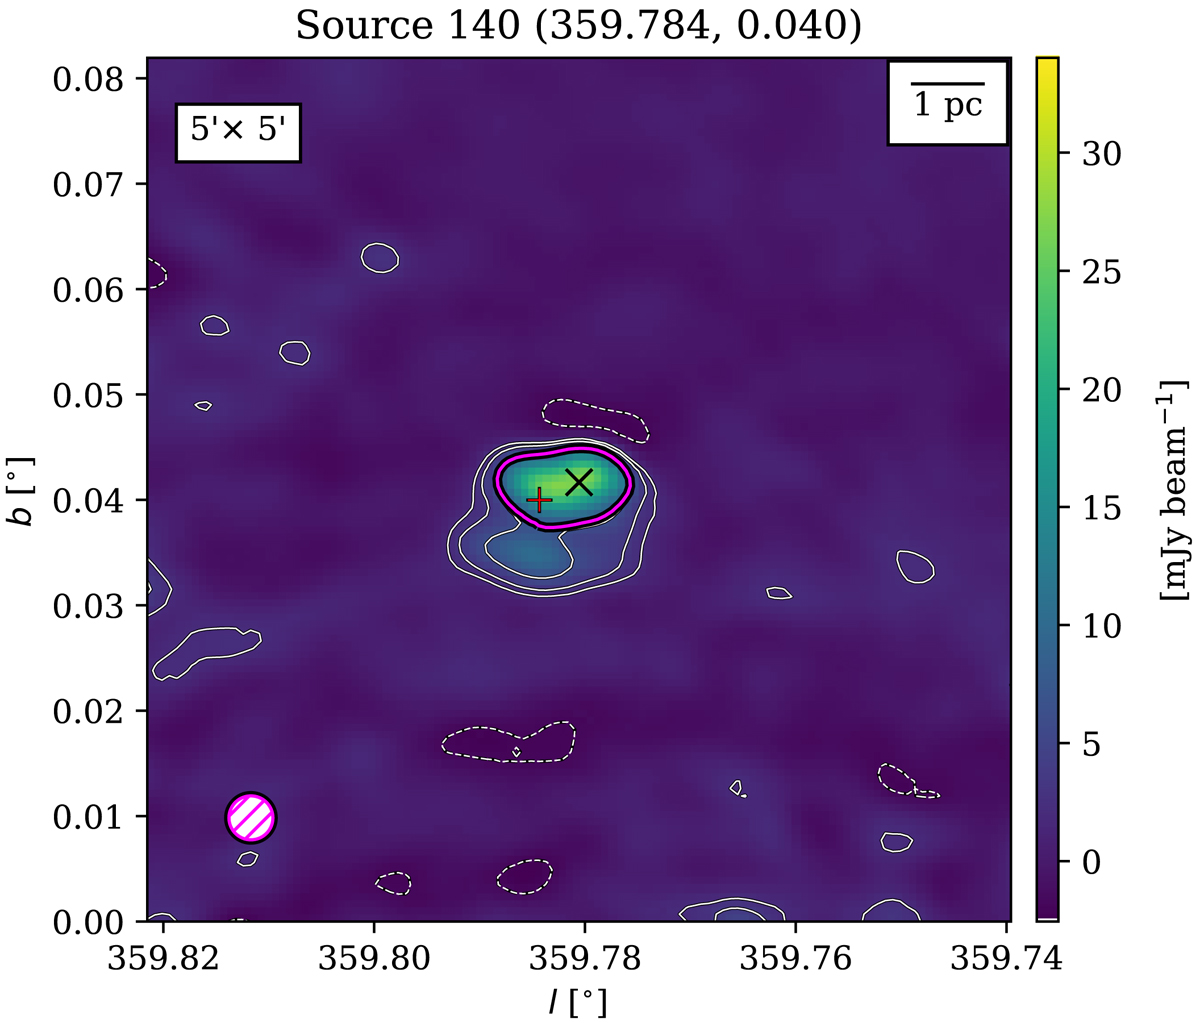
Detection of a GLOSTAR 5.8 GHz counterpart for source 140 from Nandakumar et al. (2018). The GLOSTAR 5.8 GHz continuum map is shown in colour with positions of the peak radio emission and the YSO marked with a black X and red cross, respectively. White contours correspond to 3, 5, and 10σ (σ = 0.634 mJy beam−1). The magenta contour outlines the area from which the flux density was calculated. The colour bar maximum was chosen to be 1.5× the peak intensity of the coinciding 5.8 GHz source. The beamsize is shown in magenta in the bottom left corner.
Current usage metrics show cumulative count of Article Views (full-text article views including HTML views, PDF and ePub downloads, according to the available data) and Abstracts Views on Vision4Press platform.
Data correspond to usage on the plateform after 2015. The current usage metrics is available 48-96 hours after online publication and is updated daily on week days.
Initial download of the metrics may take a while.