Fig. C.1.
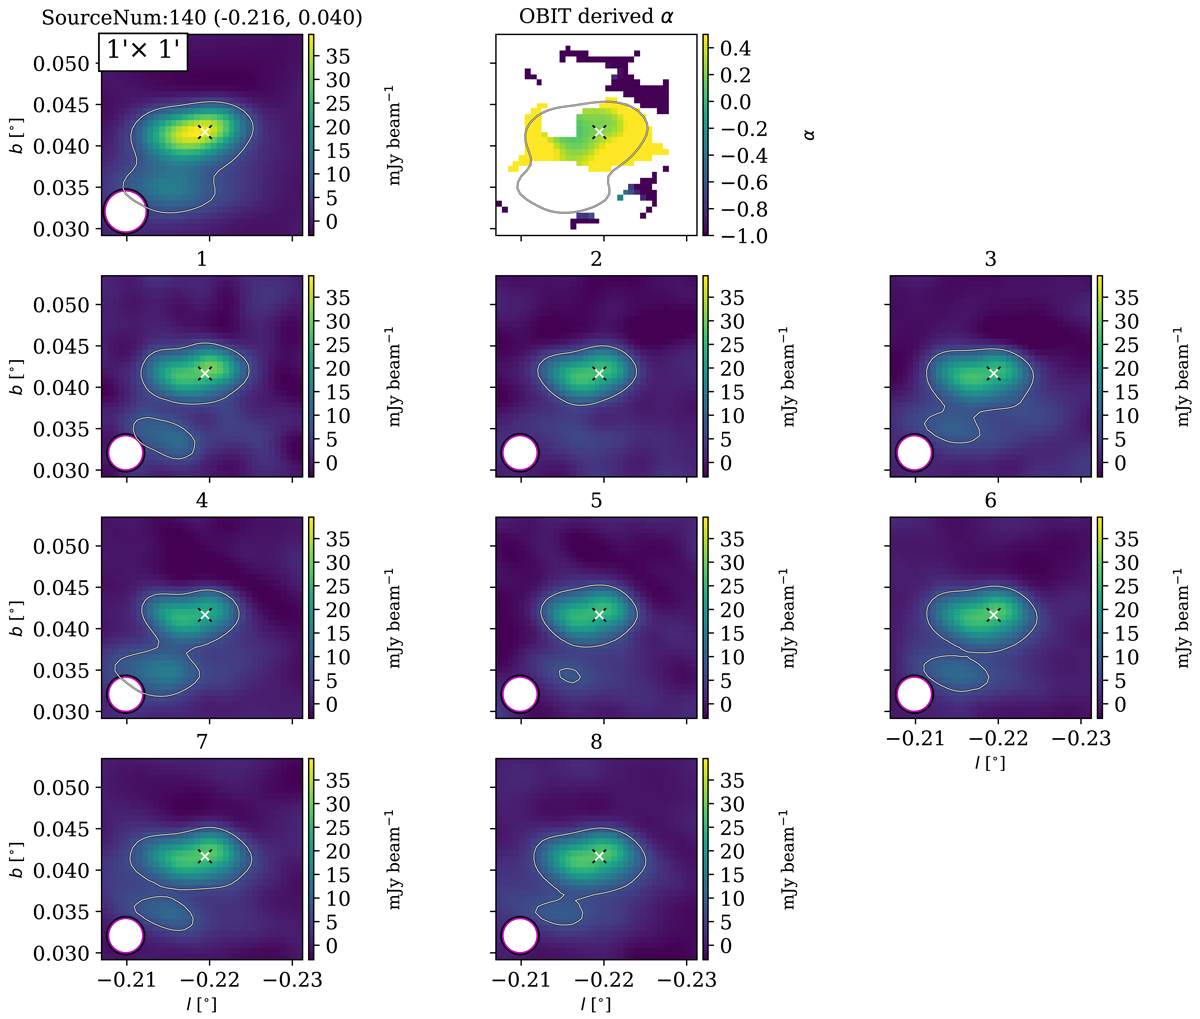
GLOSTAR continuum images of source 140 used for the determination of the spectral index. The top-left image is the combined image at 5.8 GHz, while the remaining 1–8 are from the individual frequency bands. Band 9 is omitted due to high noise. Shown also is the spectral index map produced by OBIT. The contour corresponds to the 5σ level of the combined image (7.608 mJy beam−1) and used for comparison at each frequency. The combined contour is also overplotted atop the spectral index map. The ‘x’ marker denotes the position of the peak pixel from the combined image. The calculated spectral index for this source is α = 0.23 ± 0.09.
Current usage metrics show cumulative count of Article Views (full-text article views including HTML views, PDF and ePub downloads, according to the available data) and Abstracts Views on Vision4Press platform.
Data correspond to usage on the plateform after 2015. The current usage metrics is available 48-96 hours after online publication and is updated daily on week days.
Initial download of the metrics may take a while.