Open Access
Fig. 10.
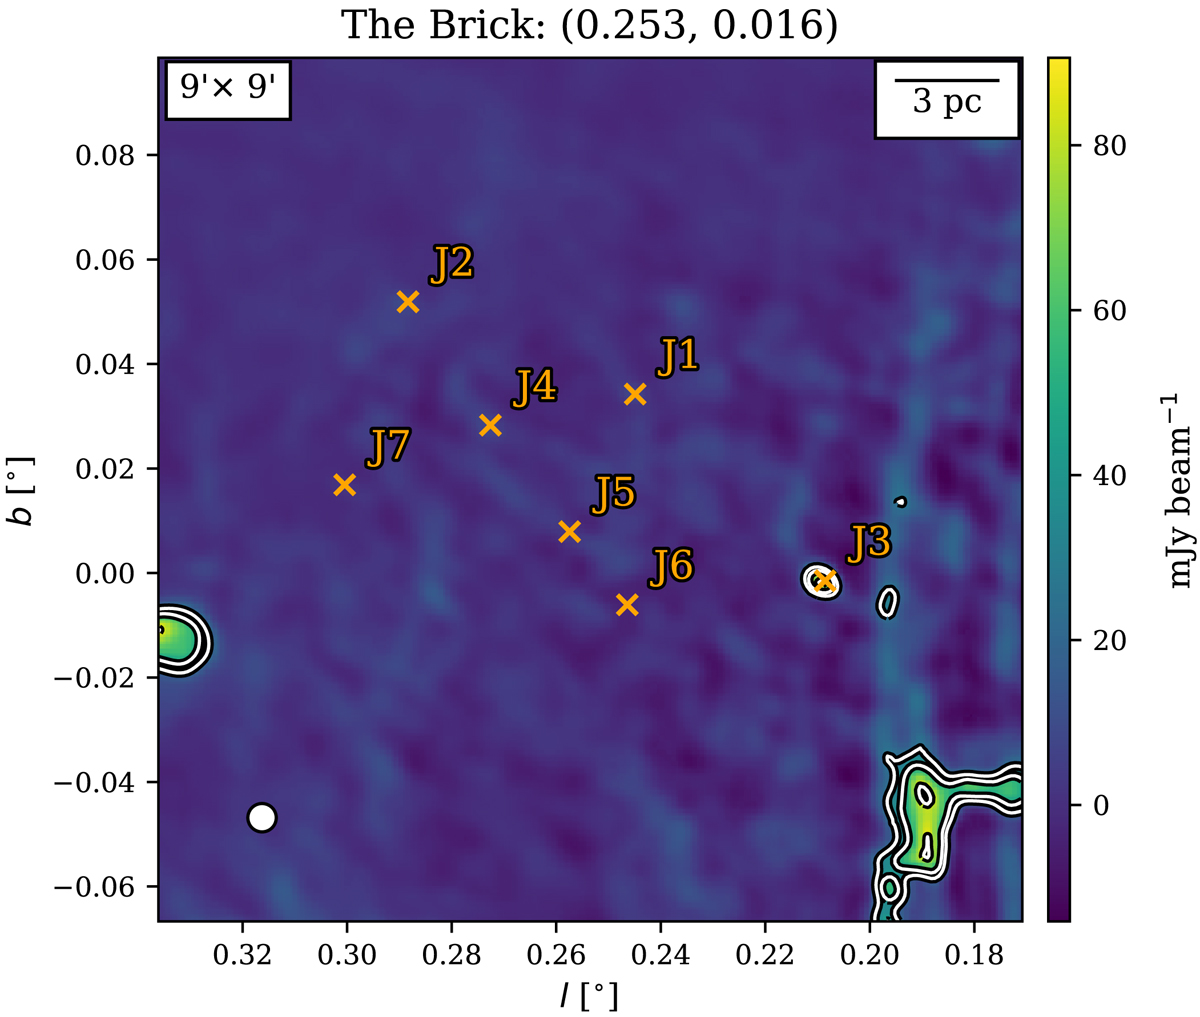
GLOSTAR cutout of a 9′ × 9′ area encompassing the region known as ‘the Brick’. Plotted in white contours are 3, 5, and 10 times the local rms (8 mJy beam−1). Labelled in orange are the positions and names of the seven radio sources found by Rodríguez & Zapata (2013) using the VLA B- and C-configuration.
Current usage metrics show cumulative count of Article Views (full-text article views including HTML views, PDF and ePub downloads, according to the available data) and Abstracts Views on Vision4Press platform.
Data correspond to usage on the plateform after 2015. The current usage metrics is available 48-96 hours after online publication and is updated daily on week days.
Initial download of the metrics may take a while.