Fig. 1.
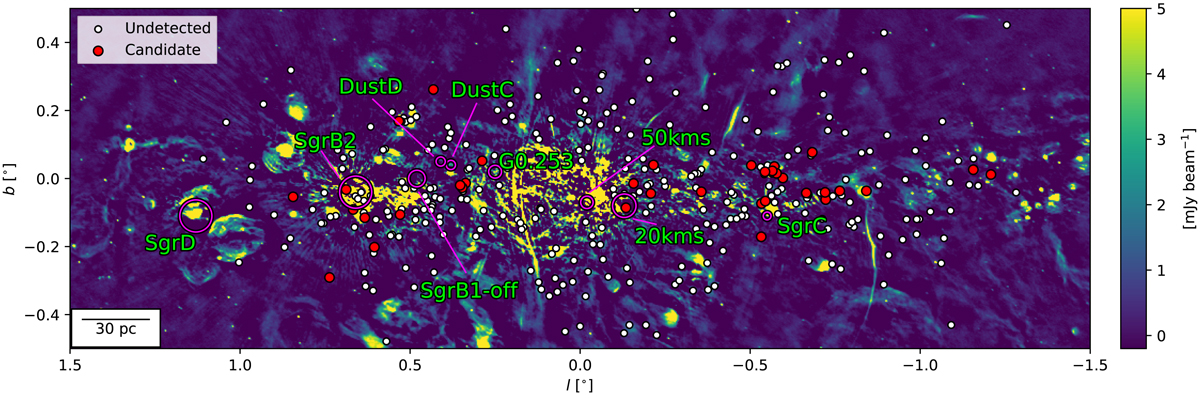
GLOSTAR 5.8 GHz detections towards YSOs from Nandakumar et al. (2018, red circles). Non-detections are shown as white dots. The background image shows the GLOSTAR 5.8 GHz D-configuration continuum image restricted to the region studied by Nandakumar et al. (2018). The image has been clipped with minimum and maximum limits of −0.1 mJy beam−1 and 5 mJy beam−1, respectively, to better emphasise visibility of the low intensity radio features. The main GMCs presented in the CMZ are highlighted with purple circles with effective radii from Kauffmann et al. (2017) and the references therein.
Current usage metrics show cumulative count of Article Views (full-text article views including HTML views, PDF and ePub downloads, according to the available data) and Abstracts Views on Vision4Press platform.
Data correspond to usage on the plateform after 2015. The current usage metrics is available 48-96 hours after online publication and is updated daily on week days.
Initial download of the metrics may take a while.