Fig. 6.
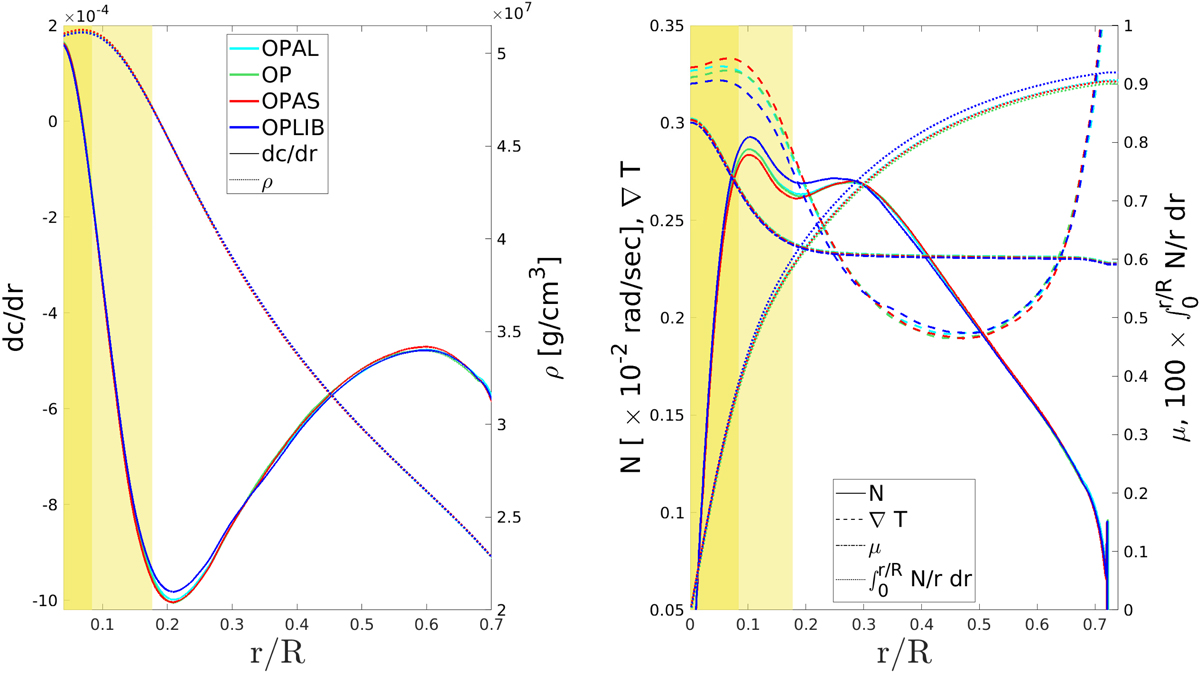
Comparison of acoustic variables in SSMs computed with different opacity tables, as reported in the legend of the left panel. Left panel: sound speed derivative and density as a function of the radius. Right panel: N, ∇T, μ, and the integral of N/r along the radius. The meaning of the different curves in the panels are given in their respective legends. The areas shaded in yellow and light yellow respectively indicate the regions (starting from r/R = 0) in which ∼95% of Φ(B) and Φ(N) are emitted.
Current usage metrics show cumulative count of Article Views (full-text article views including HTML views, PDF and ePub downloads, according to the available data) and Abstracts Views on Vision4Press platform.
Data correspond to usage on the plateform after 2015. The current usage metrics is available 48-96 hours after online publication and is updated daily on week days.
Initial download of the metrics may take a while.