Fig. 3.
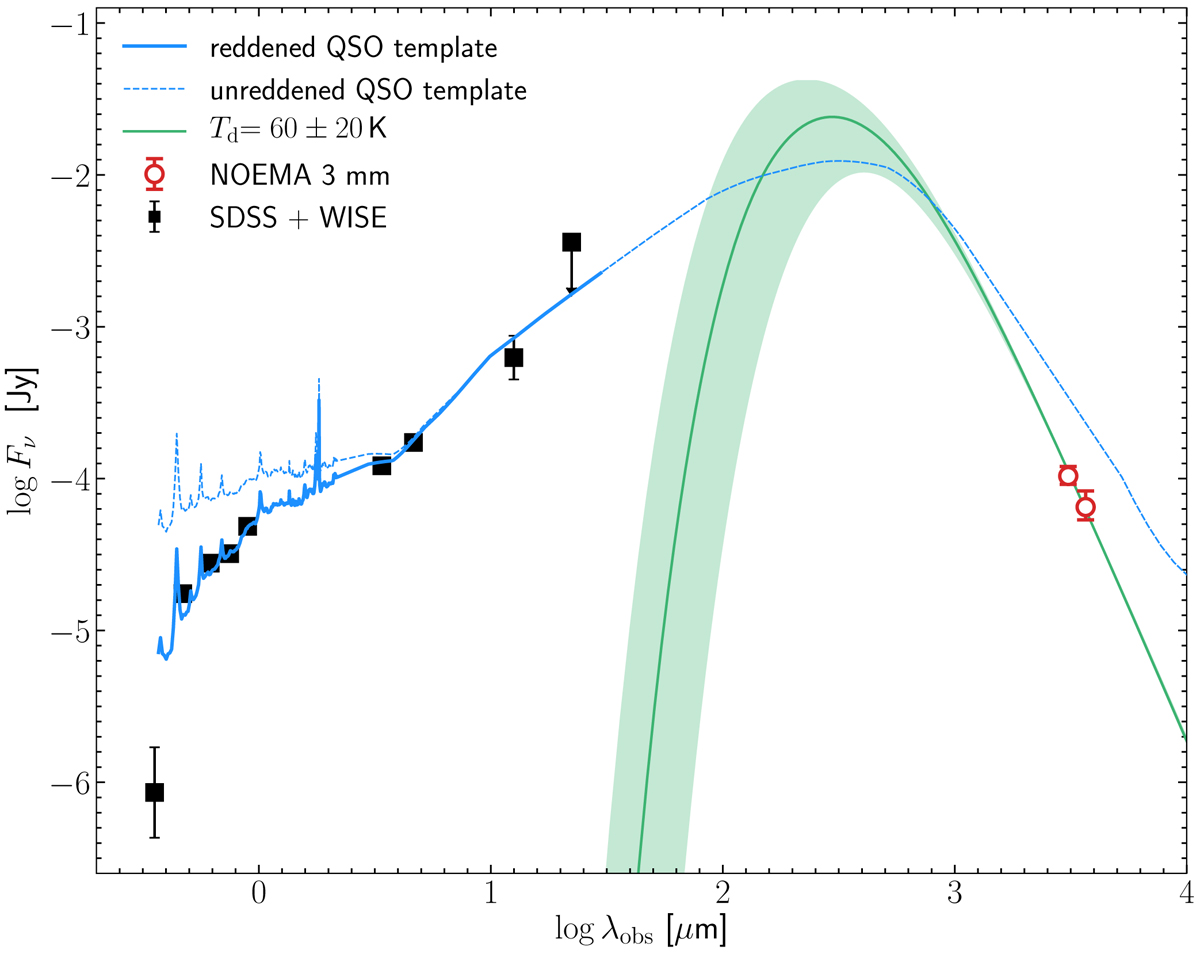
Fit to the spectral energy distribution of the quasar J0015+1842 using photometric points from SDSS and WISE (black squares). The solid (resp. dotted) blue line shows the reddened (resp. unreddened) quasar type I template from Polletta et al. (2007). The NOEMA continuum measurements at 3.08 and 3.67 mm are represented by the red circles with error bars, and the associated constraint on the cold dust emission component assuming Td = 60 ± 20 K is shown in green.
Current usage metrics show cumulative count of Article Views (full-text article views including HTML views, PDF and ePub downloads, according to the available data) and Abstracts Views on Vision4Press platform.
Data correspond to usage on the plateform after 2015. The current usage metrics is available 48-96 hours after online publication and is updated daily on week days.
Initial download of the metrics may take a while.