Fig. 1.
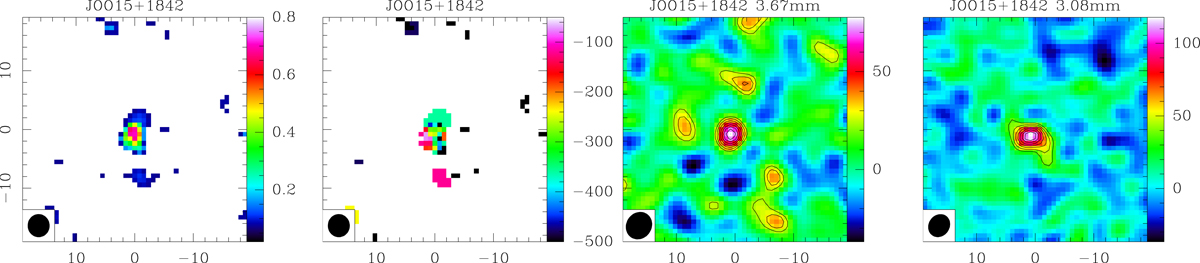
From left to right: CO(3–2) integrated map, CO(3–2) velocity map, and continuum maps in the two sidebands (lower, 3.67 mm, and upper, 3.08 mm). The colour scale in each panel is in units of Jy beam−1 × km s−1, km s−1, and μJy beam−1, respectively. The contours in the rightmost panels are drawn from 30 to 100% by 10% of the maximum, which is 78 μJy beam−1 and 118 μJy beam−1. All axes are in offset arcseconds from the central position RA = 00:15:14.81 Dec = 18:42:12.30.
Current usage metrics show cumulative count of Article Views (full-text article views including HTML views, PDF and ePub downloads, according to the available data) and Abstracts Views on Vision4Press platform.
Data correspond to usage on the plateform after 2015. The current usage metrics is available 48-96 hours after online publication and is updated daily on week days.
Initial download of the metrics may take a while.