Fig. 5
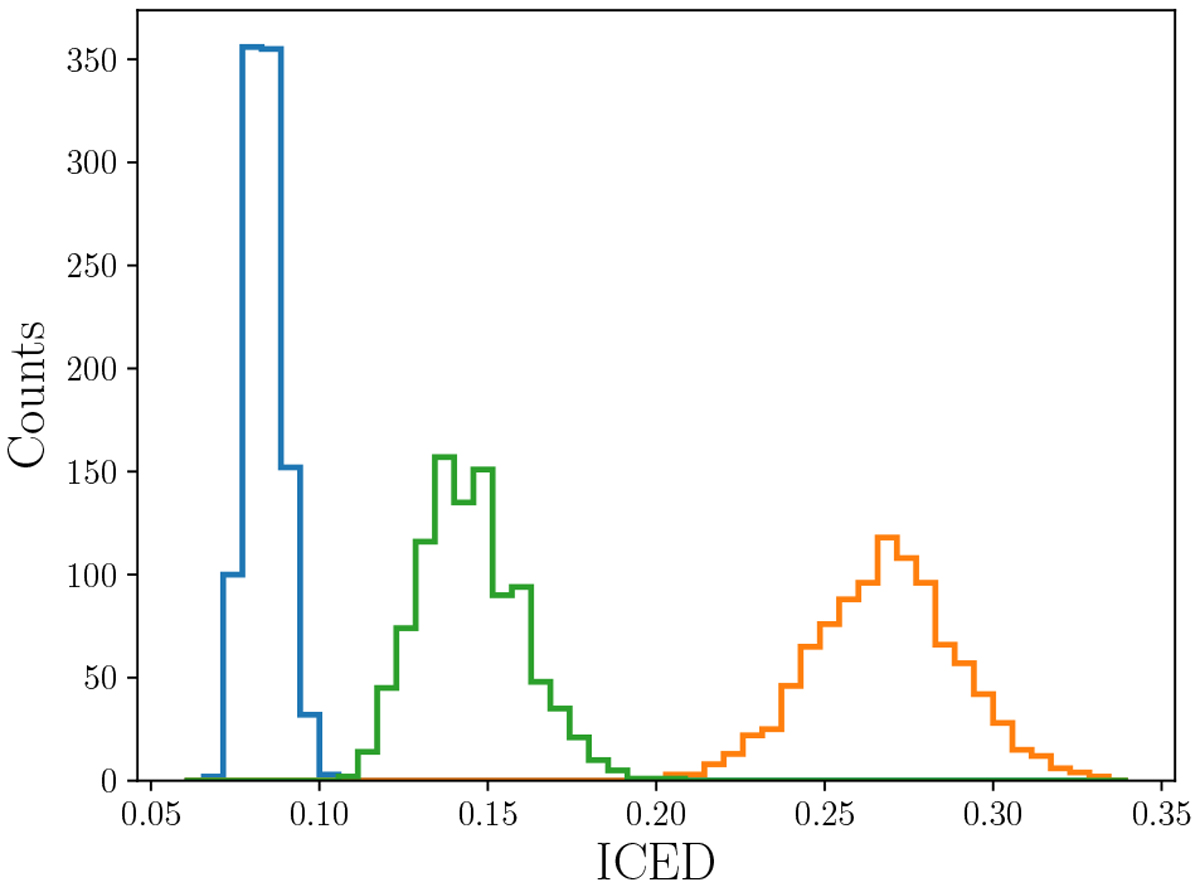
Histograms of ICED values for the three tests described in the main text. Each histogram represents 1000 simulated catalogues that deviate in some way from the original set of 129 high-multiplicity (Np ≥ 3) Kepler systems. The blue and orange histograms show the properties of all planets drawn from alog-normal distribution around the original values, with a standard deviation of 0.1 and 0.3, respectively. The green histogram is the same as the blue histogram except that it includes the possibility of changing each system’s planet multiplicity by drawing the number of planets per system from a uniform distribution between zero planets and the actual number of planets detected around that system,
![]() .
.
Current usage metrics show cumulative count of Article Views (full-text article views including HTML views, PDF and ePub downloads, according to the available data) and Abstracts Views on Vision4Press platform.
Data correspond to usage on the plateform after 2015. The current usage metrics is available 48-96 hours after online publication and is updated daily on week days.
Initial download of the metrics may take a while.