Fig. 4
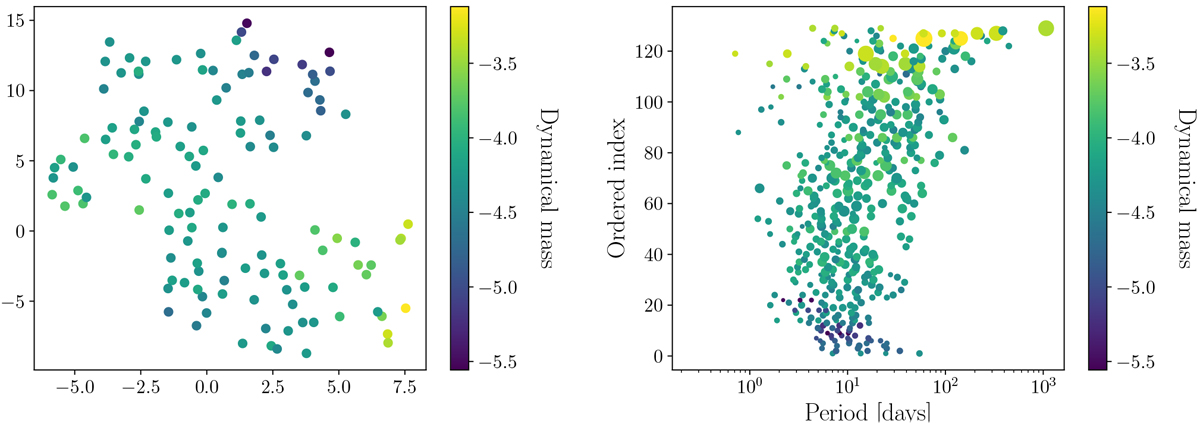
Results of using the WED in the context of machine-learning exploratory tools: t-SNE (left) and the Sequencer (right). In both cases, it seems there is a clear trend with the order of systems based on dynamical mas (μ). It is important to note that each point on the t-SNE plot represents a single planetary system, while on the Sequencer plot each row of points represents a single planetary system.
Current usage metrics show cumulative count of Article Views (full-text article views including HTML views, PDF and ePub downloads, according to the available data) and Abstracts Views on Vision4Press platform.
Data correspond to usage on the plateform after 2015. The current usage metrics is available 48-96 hours after online publication and is updated daily on week days.
Initial download of the metrics may take a while.