Fig. 2
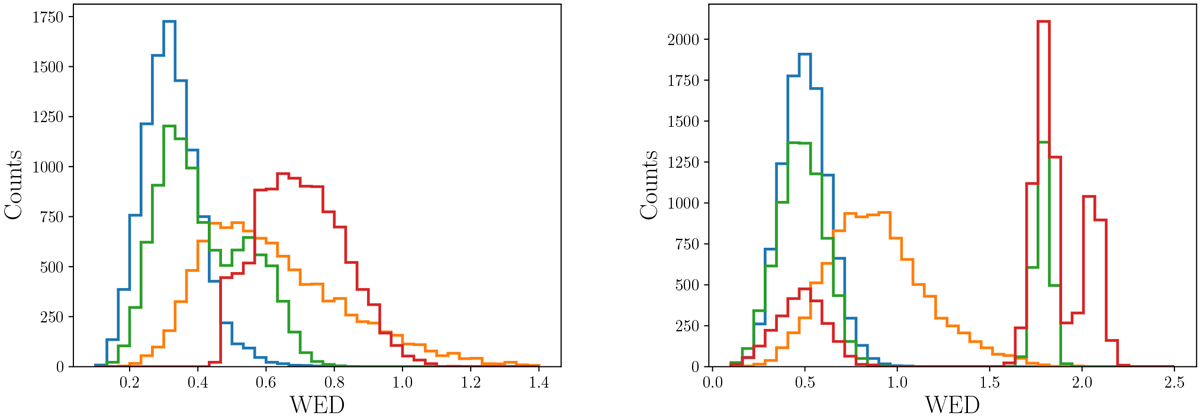
Histograms of WED values for the four tests described in the main text. Each histogram represents 10 000 simulated architectures that deviate in some way from the original four-planet system of Kepler-107 (left panel) and Kepler-65 (right panel). The blue and orange histograms show the properties of all four planets drawn from a log-normal distribution around the original values, with a standard deviation of 0.1 and 0.3, respectively. The green histogram represents the same as the blue, but with only three of the four original planets, where the excluded planet is chosen randomly. The red shows the case where only one of the original planets is retained, chosen at random, with its properties again drawn from a log-normal distribution with a standard deviation of 0.1.
Current usage metrics show cumulative count of Article Views (full-text article views including HTML views, PDF and ePub downloads, according to the available data) and Abstracts Views on Vision4Press platform.
Data correspond to usage on the plateform after 2015. The current usage metrics is available 48-96 hours after online publication and is updated daily on week days.
Initial download of the metrics may take a while.