Fig. 3
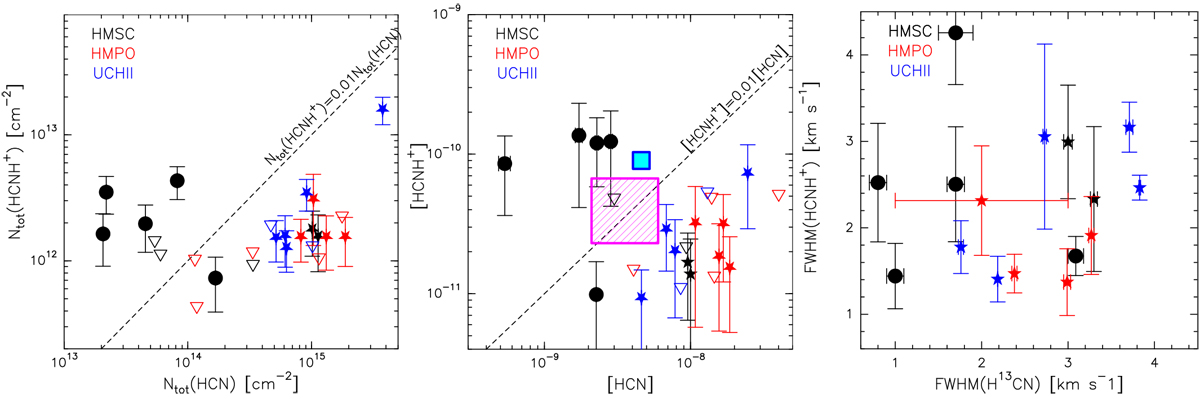
Left panel: comparison between Ntot (HCNH+) and Ntot (HCN). The latter was derived from the H13CN J = 1− 0 line (Colzi et al. 2018b), assuming the same Tex, by correcting it for the 12C/13C ratio obtained at the Galactocentric distance of the sources from the trend of Yan et al. (2019). Ntot (HCNH+) has been rescaled to the (larger) beam of the H13CN observations, ~ 28′′. Red stars are HMPOs; blue stars are UCHIIs; black symbols are HMSCs (filled circles for quiescent,stars for warm; see Table 1). Triangles indicate upper limits on Ntot (HCNH+). The dashed line is the locus where Ntot (HCNH+) = 0.01 Ntot (HCN). Middle panel: same as left panel, but for the fractional abundances with respect to H2 calculated on a beam of ~28′′. The purple rectangle indicates the range of abundances that reproduces the observed [HCN], and [HCNH+] in the predictions of the WM (see Sect. 5 and right panel of Fig. 7). Similarly, the cyan square indicates the prediction of the CM (see Sect. 5 and left panel of Fig. 7). Right panel: comparison between the line FWHM of HCNH+, derived in this work from the J = 3−2 line, and H13 CN, derived by Colzi et al. (2018a) from the J = 1−0 line at ~87 GHz. The symbols have the same meaning as those in the left and middle panels.
Current usage metrics show cumulative count of Article Views (full-text article views including HTML views, PDF and ePub downloads, according to the available data) and Abstracts Views on Vision4Press platform.
Data correspond to usage on the plateform after 2015. The current usage metrics is available 48-96 hours after online publication and is updated daily on week days.
Initial download of the metrics may take a while.