Fig. 2
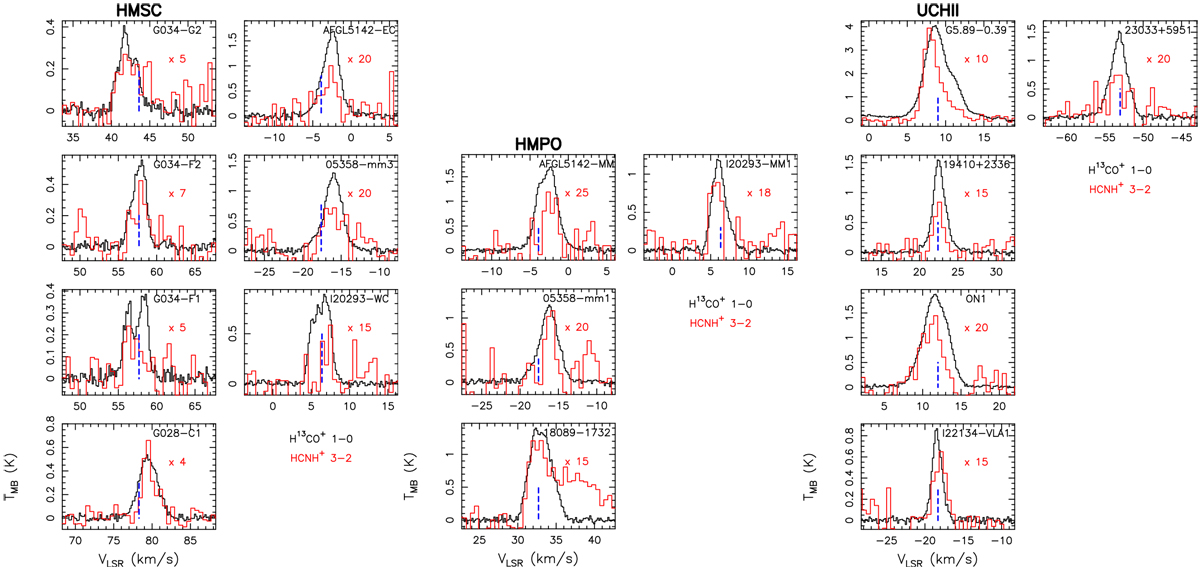
Comparison among the observed profiles of H13CO+ J = 1− 0 (black histograms) and HCNH+ J = 3−2 (red histograms) towards, from left to right, the HMSCs, the HMPOs, and the UCHIIs detected in HCNH+ (Table 1). The red number in each plot indicates the multiplicative factor applied to the HCNH+ spectrum. The blue dashed vertical line indicates the systemic velocity used to centre the observed spectra (see e.g. Fontani et al. 2015a). The peak velocities of HCNH+ are listed in Table 1.
Current usage metrics show cumulative count of Article Views (full-text article views including HTML views, PDF and ePub downloads, according to the available data) and Abstracts Views on Vision4Press platform.
Data correspond to usage on the plateform after 2015. The current usage metrics is available 48-96 hours after online publication and is updated daily on week days.
Initial download of the metrics may take a while.