Fig. 4
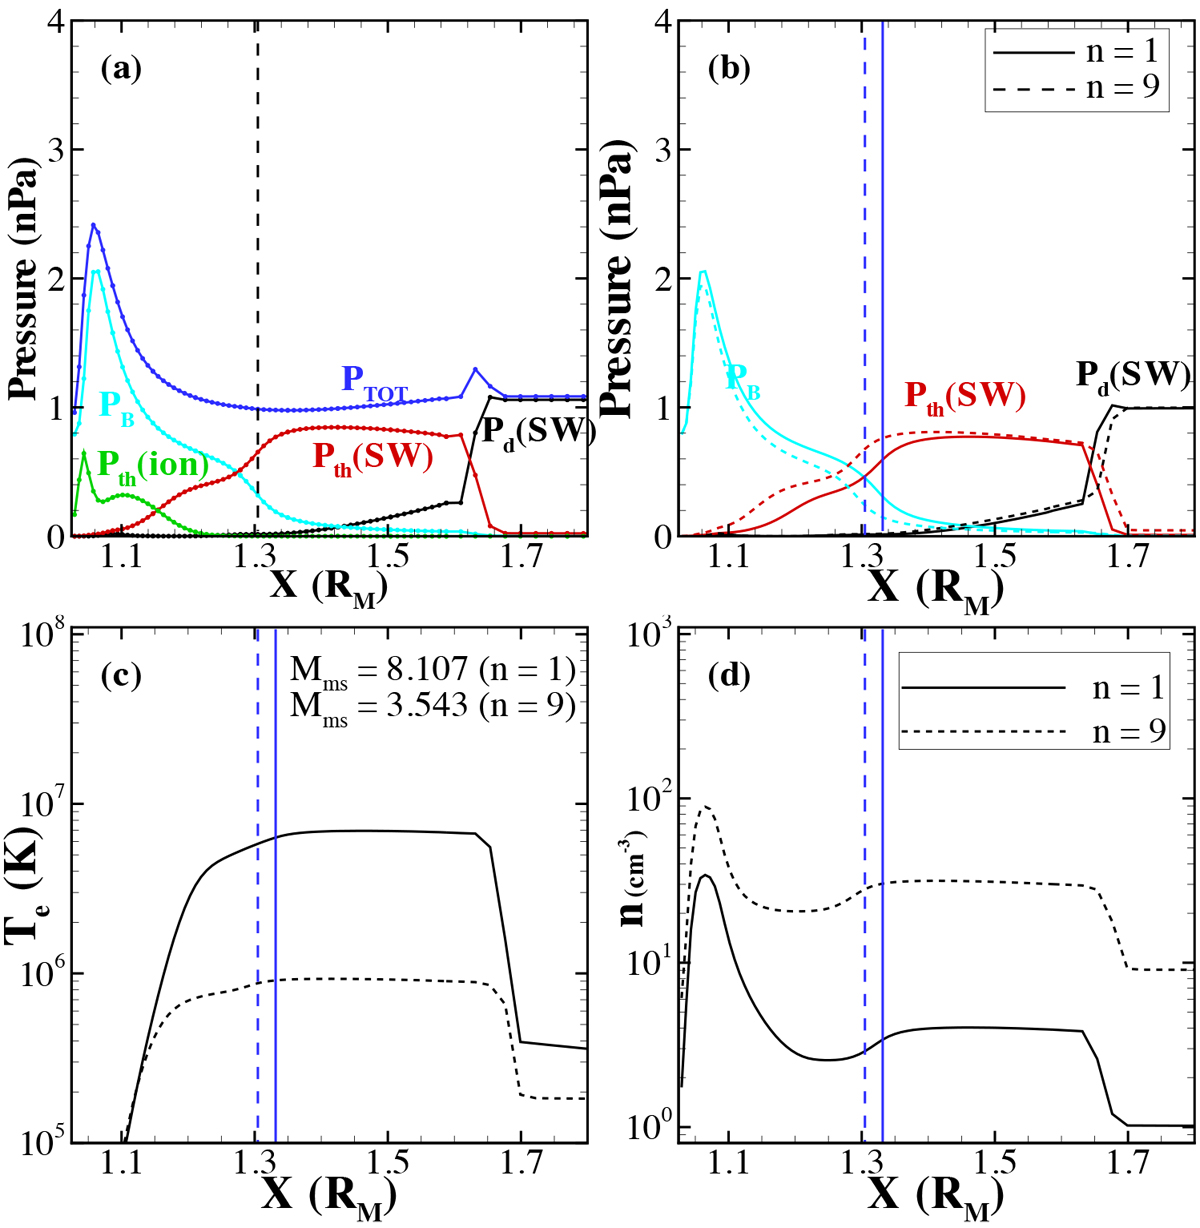
Pressure profiles along the Sun-Mars line on the dayside with the same solar wind condition as in Case 1 of Ma et al. (2004) for panel a. The solid black, red, green, cyan, and blue lines represent the solar wind dynamic pressure Pd (SW), the solar wind plasma thermal pressure Pth(SW), the ionosphere thermal pressure Pth(ion), the magnetic pressure PB, and the totalpressure P(SW), respectively.The small circles indicate the positions of the radial grid points, and the vertical dashed line represents the identified location of the subsolar standoff point of the Martian MPB. Panel b: similar pressure profiles for n = 1 (solid lines) and 9 (dashed lines) cm−3 when Pd = 1 nPa. The black, red, and cyan lines stand for Pd(SW), Pth (SW), and PB, respectively. The vertical blue lines represent the corresponding identified locations of the subsolar standoff point of the Martian MPB. Panels c and d: corresponding conditions of the solar wind electron temperature (Te (K)) and thesolar wind number density (n (cm−3)) for panel b along the Sun-Mars line.
Current usage metrics show cumulative count of Article Views (full-text article views including HTML views, PDF and ePub downloads, according to the available data) and Abstracts Views on Vision4Press platform.
Data correspond to usage on the plateform after 2015. The current usage metrics is available 48-96 hours after online publication and is updated daily on week days.
Initial download of the metrics may take a while.