Fig. 2
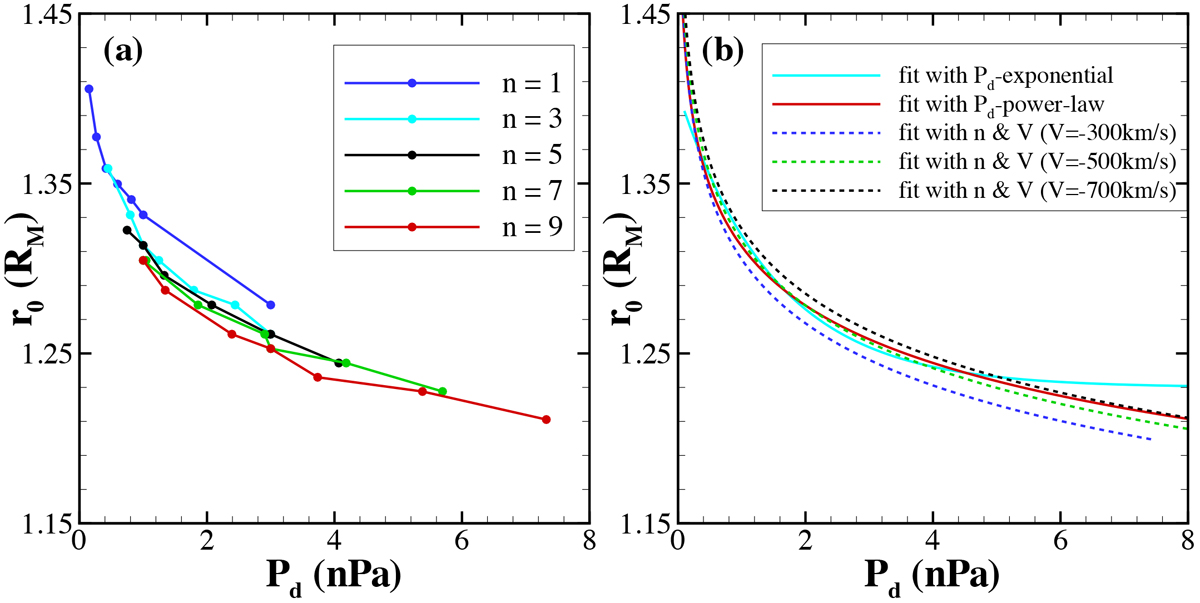
Solar wind dynamic pressure dependence on the subsolar standoff distance of the Martian MPB. Panel a: r0 identified from the simulation data for the solar wind number density n = 1 (blue), 3 (cyan), 5 (black), 7 (green), and 9 (red) cm−3. The solid line segments connect adjacent points. Panel b: fitting results by the exponential function (solid cyan line), by the power-law relations considering Pd alone, ![]() (solid red line), and n and V individually, r0(RM) = cn−1∕d|V |−2∕e (dashed lines). The dashed blue, green, and black lines represent the fitting results for V = −300, −500, and −700 km s−1, respectively.
(solid red line), and n and V individually, r0(RM) = cn−1∕d|V |−2∕e (dashed lines). The dashed blue, green, and black lines represent the fitting results for V = −300, −500, and −700 km s−1, respectively.
Current usage metrics show cumulative count of Article Views (full-text article views including HTML views, PDF and ePub downloads, according to the available data) and Abstracts Views on Vision4Press platform.
Data correspond to usage on the plateform after 2015. The current usage metrics is available 48-96 hours after online publication and is updated daily on week days.
Initial download of the metrics may take a while.