Fig. 7.
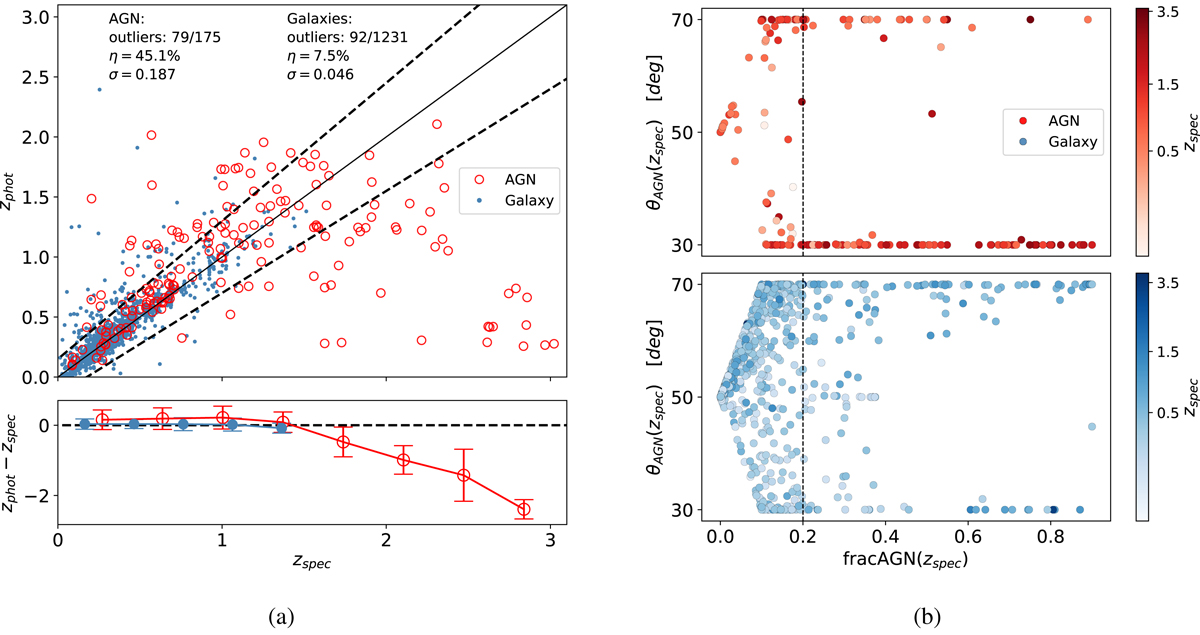
Visualization of parameters used during SED analysis on the training data. XAGN were excluded from this analysis due to a lack of spectroscopic redshift. Panel a: comparison between spectroscopic redshift and photometric redshift estimation (Ho et al. 2021) for training galaxy and AGN samples. The dotted lines refer to zphot = zspec ± 0.15(1 + zspec) cone. The η describes the fraction of outliers defined as objects outside the cone. σ is the normalised median absolute deviation 1.48 × median(|Δz|/(1 + z). Lower plot shows the mean residuals with standard deviations. Only z < 3 objects are shown. Panel b: dependence of an AGN viewing angle (θ) on AGN fraction (fracAGN) for AGN and galaxy training samples. Both parameters were estimated by SED fitting using spectroscopic redshifts. θ = 30° corresponds to pure type-I AGN and θ = 70° to pure type-II with intermediate types in between. Color intensity corresponds to the spectroscopic redshift value. Dotted line shows fracAGN = 0.2 – value which defines AGNSED.
Current usage metrics show cumulative count of Article Views (full-text article views including HTML views, PDF and ePub downloads, according to the available data) and Abstracts Views on Vision4Press platform.
Data correspond to usage on the plateform after 2015. The current usage metrics is available 48-96 hours after online publication and is updated daily on week days.
Initial download of the metrics may take a while.