Fig. 6.
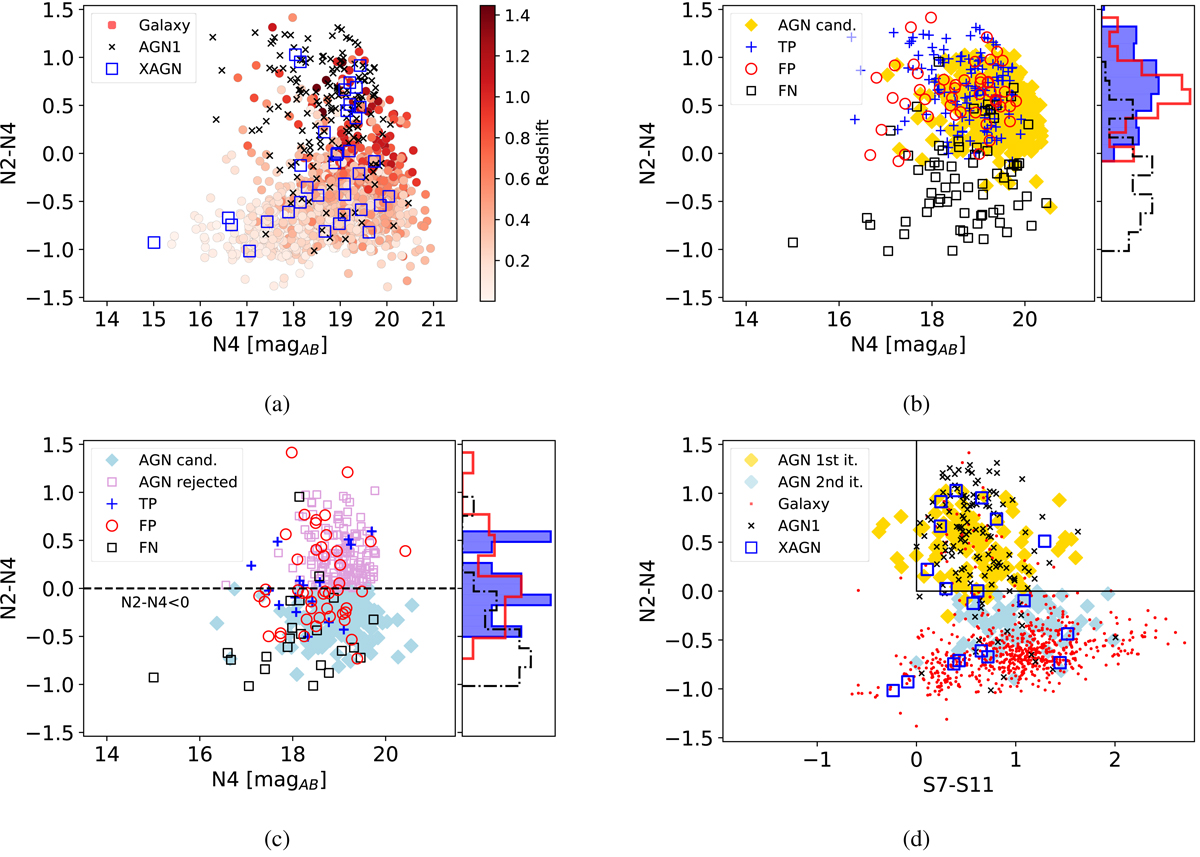
NIR and MIR properties of the training set and classification results. Panel a: properties of the training data. Color of galaxies correspond to spectroscopic redshift value. Panel b: first iteration training and final AGN catalog properties. Right part of the figure shows density histogram for components of the labeled set with corresponding color. Panel c: second iteration experiment. Modified training sample is shown as well as two parts of generalization: “rejected” objects, which occupy the red N2 − N4 color range and new objects below this range. These candidates were not included in final catalog. Right part of the figure shows density histogram for components of the labeled set with corresponding color. Panel d: color-color plot used for Lee et al. 2007 AGN selection. Its selection criteria demarcate the upper right square, marked by the black lines. Training objects and AGN candidates selected during the first and the second iteration from the present work, are shown in form of different markers. Predictions for the labeled data shown in Figs. 6b–d are compound classifications of the test data from five-fold cross-validation.
Current usage metrics show cumulative count of Article Views (full-text article views including HTML views, PDF and ePub downloads, according to the available data) and Abstracts Views on Vision4Press platform.
Data correspond to usage on the plateform after 2015. The current usage metrics is available 48-96 hours after online publication and is updated daily on week days.
Initial download of the metrics may take a while.