Fig. 3.
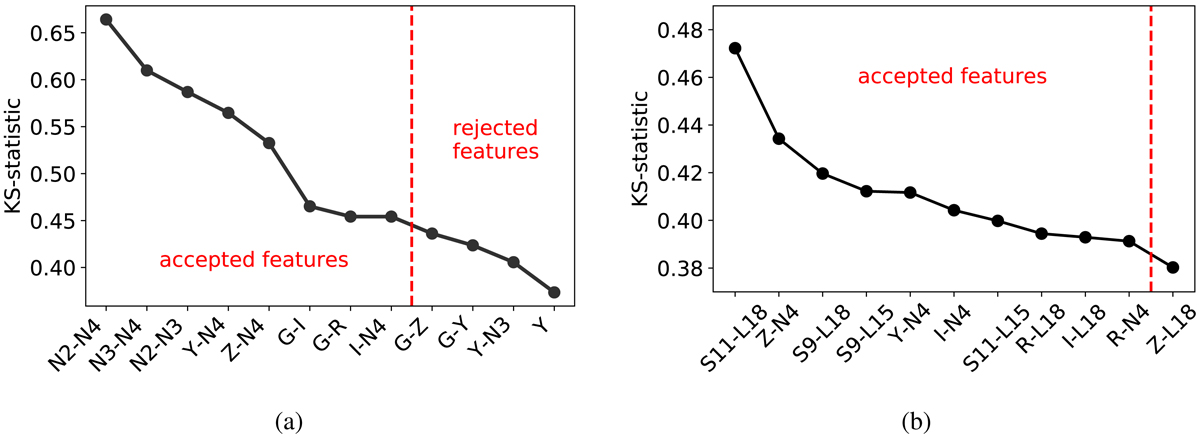
Features selected using KS-statistic value. Panel a: first (main) iteration. Panel b: second iteration experiment. For the first (main) iteration the KS-statistic was calculated on AGN and galaxy training samples using the HSC g, r, i, z, Y and IRC N2, N3, N4 bands along with all possible colors. The optimal feature set was defined as a set where all available filters were used and the KS-statistic value was not substantially lower for less important features. For the second iteration experiment, additional MIR features in form of S7, S9, S11, L15, and L18 bands and all possible colors were used. In order to minimize the risk of data sparsity, the selection of optimal feature set was restricted to features with the highest KS-statistic value. Only the most important features are shown.
Current usage metrics show cumulative count of Article Views (full-text article views including HTML views, PDF and ePub downloads, according to the available data) and Abstracts Views on Vision4Press platform.
Data correspond to usage on the plateform after 2015. The current usage metrics is available 48-96 hours after online publication and is updated daily on week days.
Initial download of the metrics may take a while.