Free Access
Fig. 1.
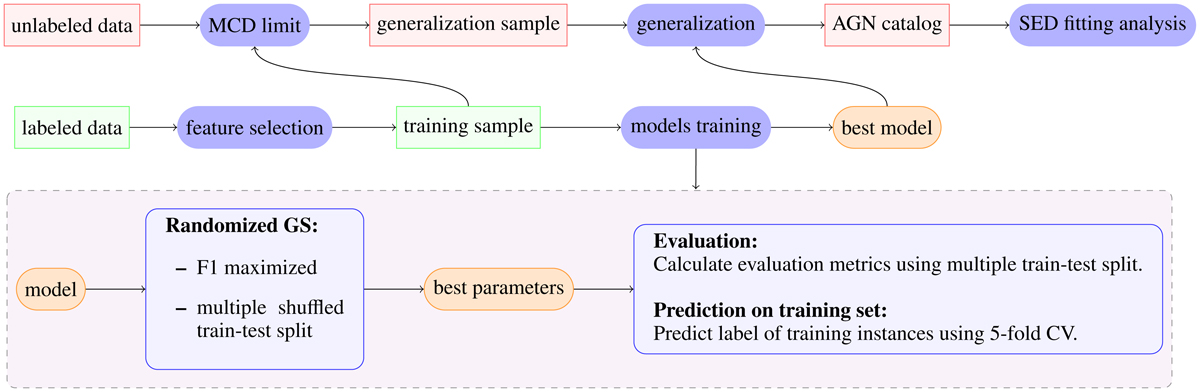
Scheme of the machine learning pipeline described in the present work. Upper part of the scheme shows the general outline, lower part of the scheme, shown in the violet rectangle, refers to the training of the models.
Current usage metrics show cumulative count of Article Views (full-text article views including HTML views, PDF and ePub downloads, according to the available data) and Abstracts Views on Vision4Press platform.
Data correspond to usage on the plateform after 2015. The current usage metrics is available 48-96 hours after online publication and is updated daily on week days.
Initial download of the metrics may take a while.