Fig. 9.
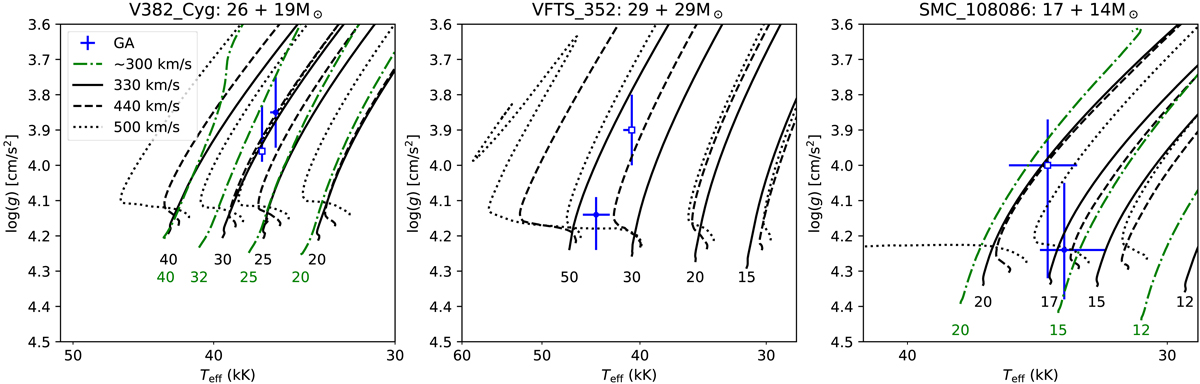
Same as Fig. 8, but in the surface gravity versus effective temperature plane. In this case, only the values and corresponding errors derived from the GA are plotted because the surface gravity is not fitted with SPAMMS. The masses corresponding to each track are indicated below, each in their respective color in units of solar masses.
Current usage metrics show cumulative count of Article Views (full-text article views including HTML views, PDF and ePub downloads, according to the available data) and Abstracts Views on Vision4Press platform.
Data correspond to usage on the plateform after 2015. The current usage metrics is available 48-96 hours after online publication and is updated daily on week days.
Initial download of the metrics may take a while.