Fig. 7
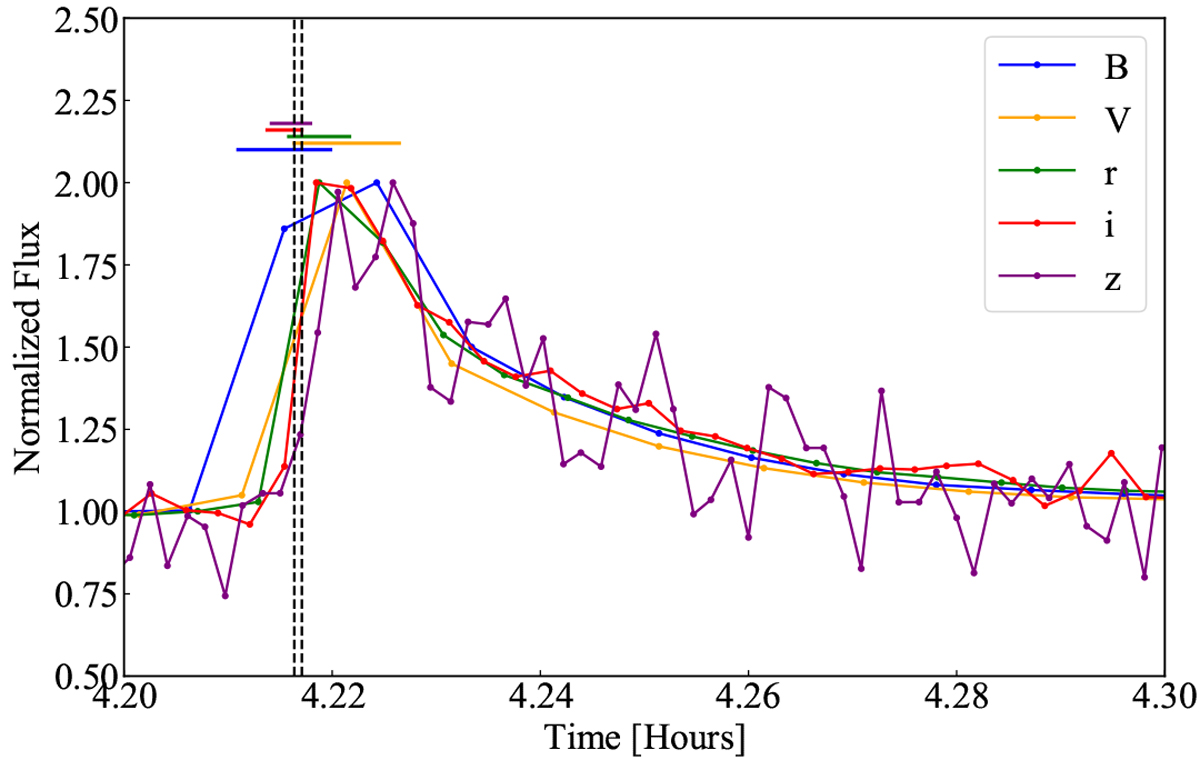
Multiband light curve of flare 2 normalized by peak flare flux. The horizontal bars indicate the integration time of the flare onset observation for each band. Because of the low S/N of the z-band observations, we extended the possible onset time of the flare by an additional exposure. The dashed lines represent the onset window for flare 2 that would satisfy the onset conditions of all the photometric bands.
Current usage metrics show cumulative count of Article Views (full-text article views including HTML views, PDF and ePub downloads, according to the available data) and Abstracts Views on Vision4Press platform.
Data correspond to usage on the plateform after 2015. The current usage metrics is available 48-96 hours after online publication and is updated daily on week days.
Initial download of the metrics may take a while.