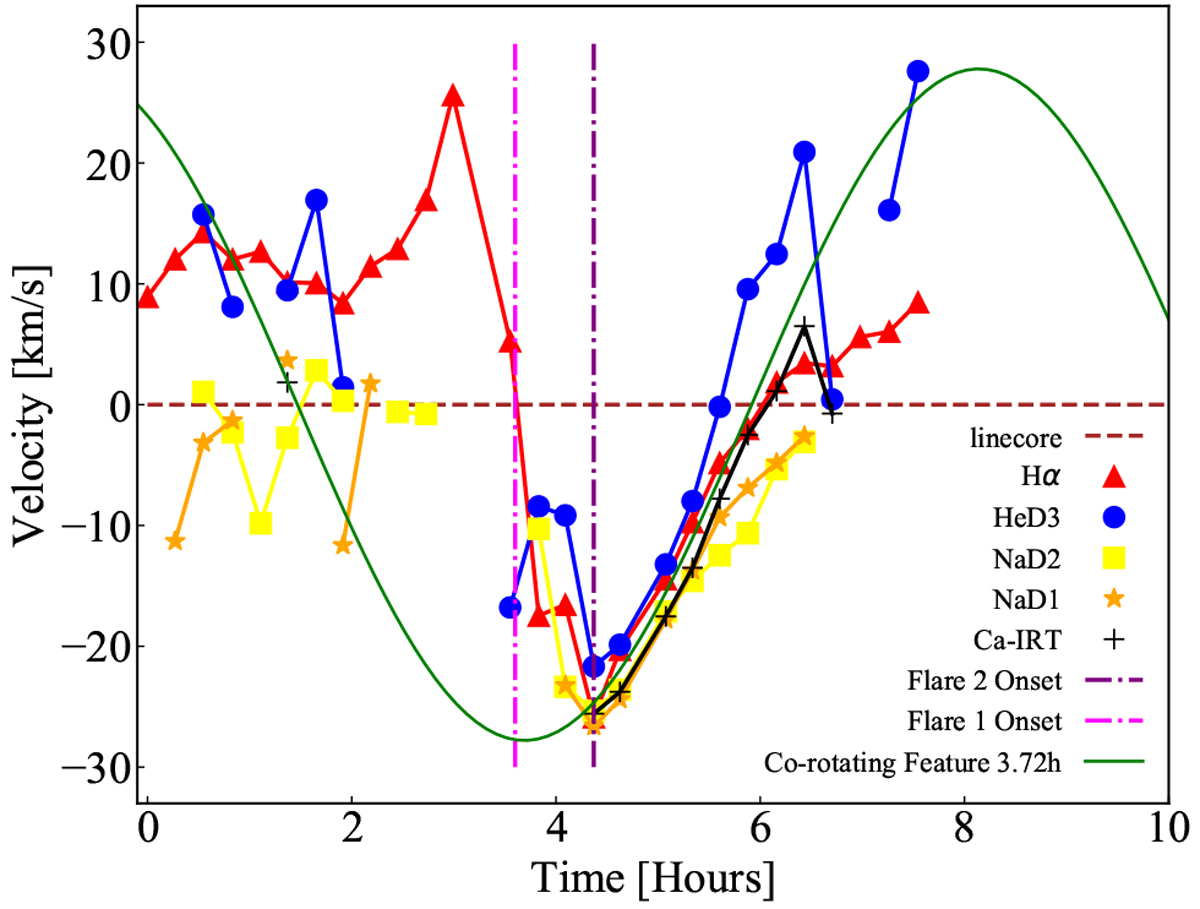
Fig. 15

Doppler shift of excess flare emission of the line cores. The missing data points indicate that a Gaussian fit was impossible, which causes the gap at about 3 h, where the minimum activity spectrum is located. All of the activity indicators shift to the blue before the flare onset (noted by vertical dotted line). Green line represents the expected Doppler shift of such an object, at 43 deg latitude, if it were to emerge onto the blue limb of the disk 3.72 h into the observation run.
Current usage metrics show cumulative count of Article Views (full-text article views including HTML views, PDF and ePub downloads, according to the available data) and Abstracts Views on Vision4Press platform.
Data correspond to usage on the plateform after 2015. The current usage metrics is available 48-96 hours after online publication and is updated daily on week days.
Initial download of the metrics may take a while.


