Fig. 14
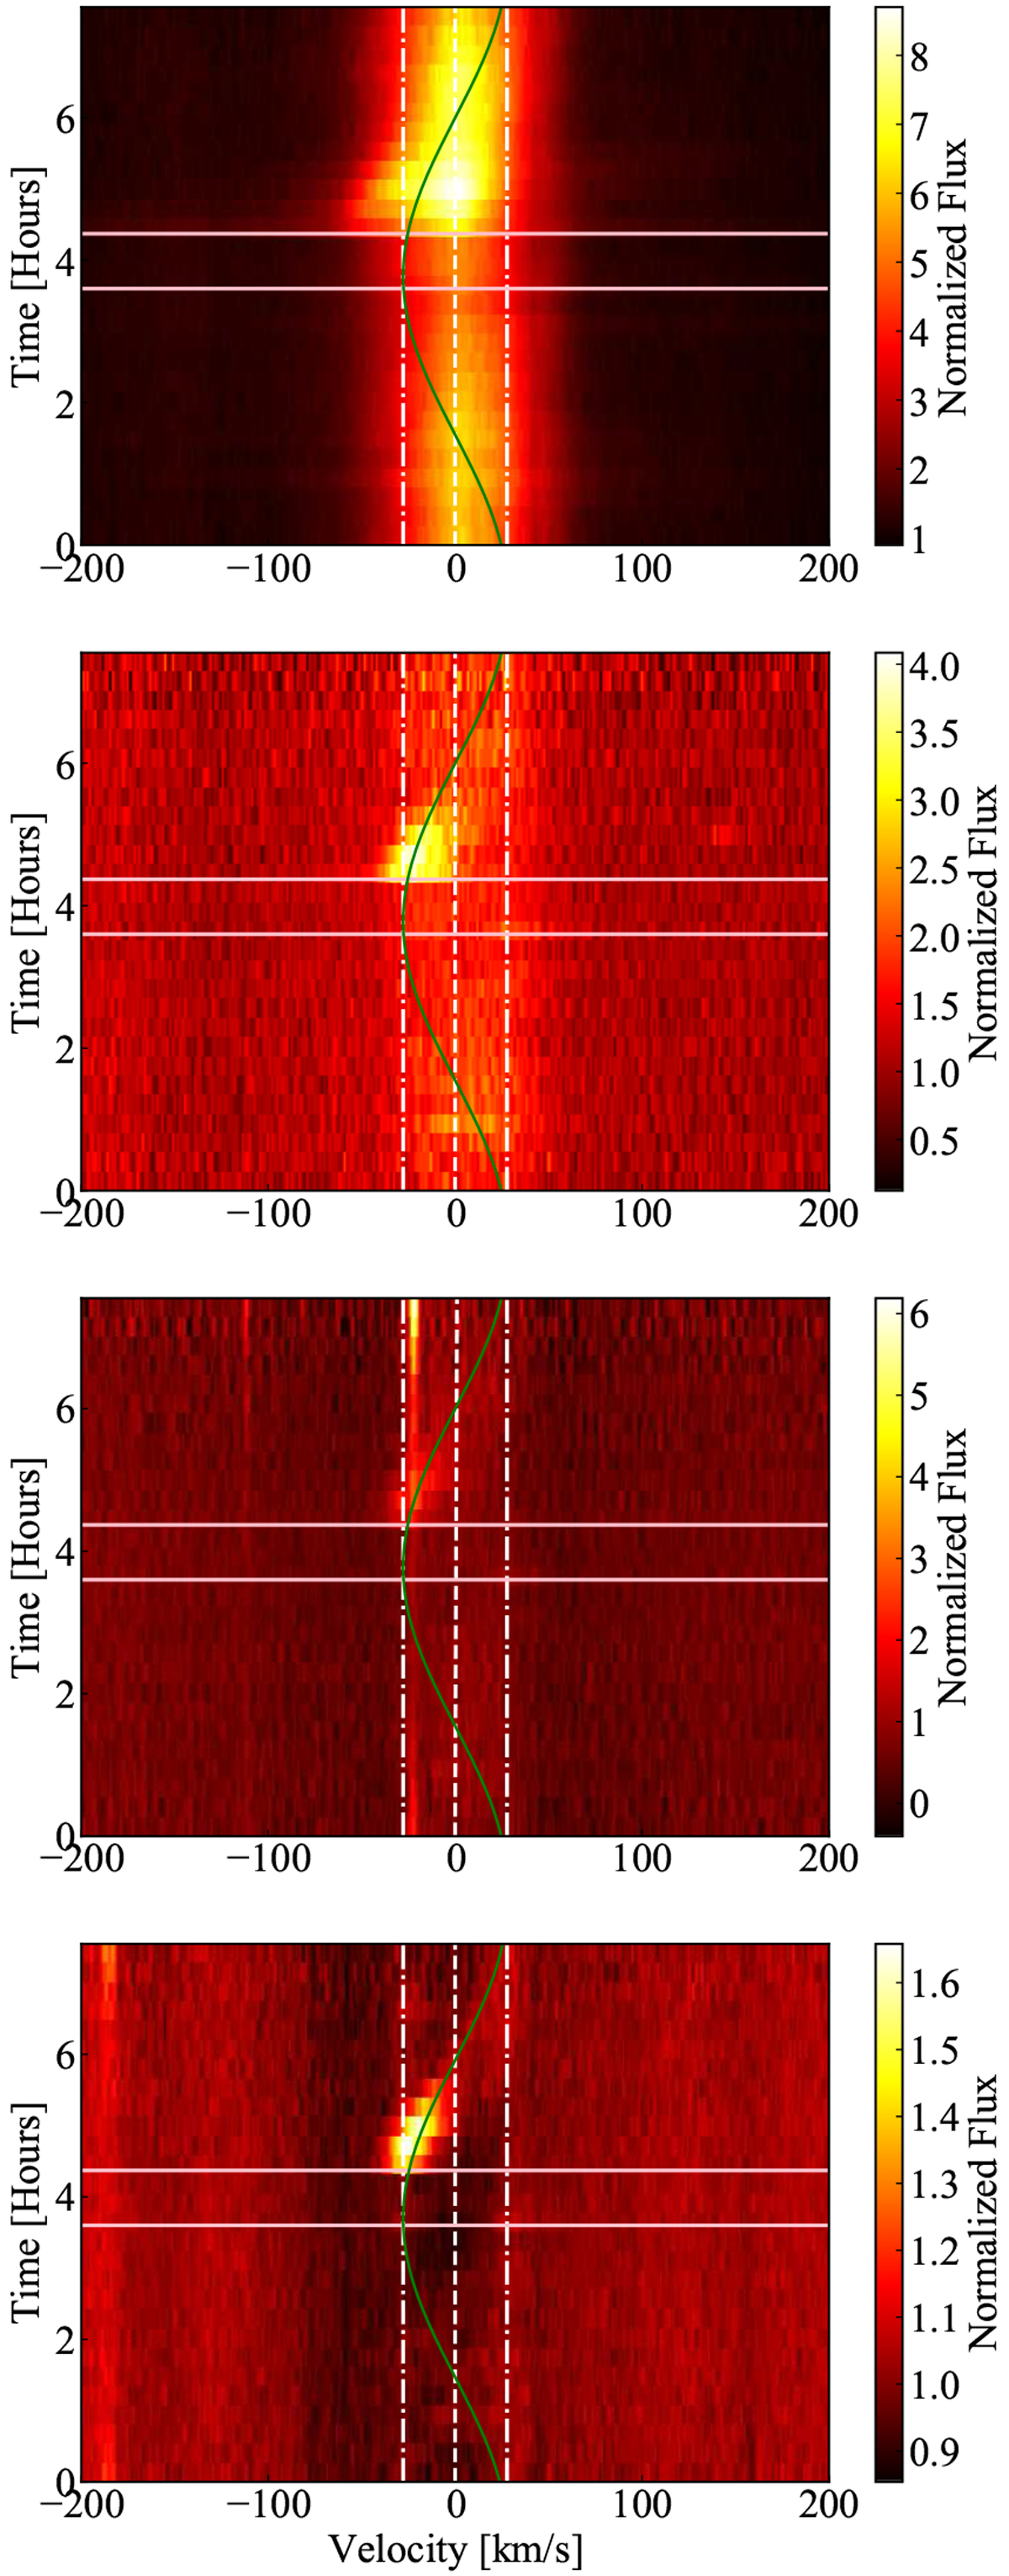
From top to bottom: Hα, He I D3, Ca II IRT, and Na I D2 flux density evolution during our observing run. The central dashed line indicates the nominal rest-frame wavelength and the outer two dash-dotted lines denote the maximum Doppler shift for a corotating object at 43 deg latitude (28.6 km s−1). The green line represents the expected Doppler shift of such an object if it were to emerge onto the blue limb of the disk 3.72 h into the observation run. Horizontal solid white lines indicate onset times of flares 1 and 2.
Current usage metrics show cumulative count of Article Views (full-text article views including HTML views, PDF and ePub downloads, according to the available data) and Abstracts Views on Vision4Press platform.
Data correspond to usage on the plateform after 2015. The current usage metrics is available 48-96 hours after online publication and is updated daily on week days.
Initial download of the metrics may take a while.