Open Access
Fig. 13
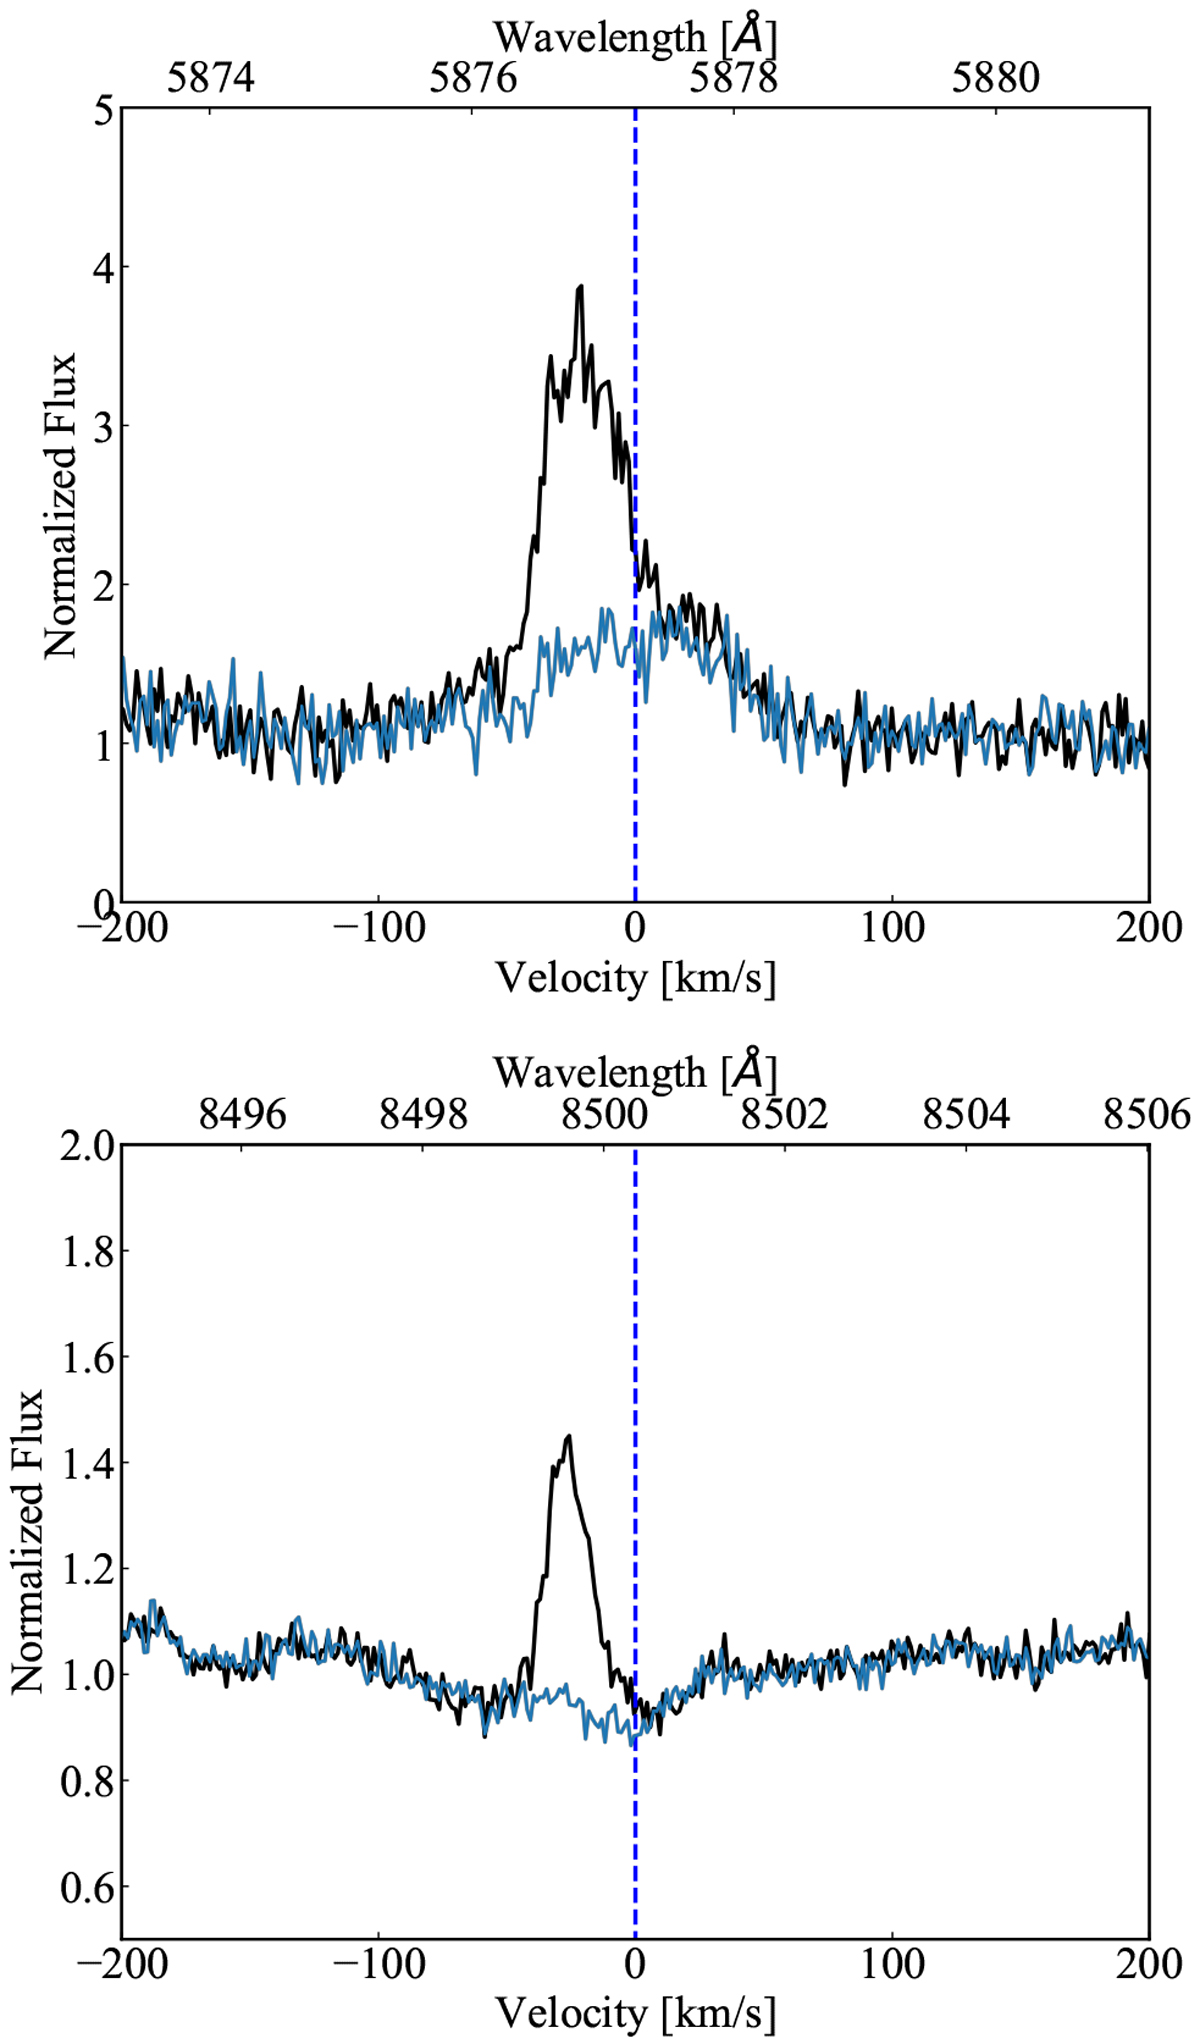
Flare emission from the He I D3 (top) and Ca II IRT lines (bottom) during flare onset (solid black, observation 17), activity minimum spectra (solid gray, observation 13). The dashed vertical line indicates the rest wavelength.
Current usage metrics show cumulative count of Article Views (full-text article views including HTML views, PDF and ePub downloads, according to the available data) and Abstracts Views on Vision4Press platform.
Data correspond to usage on the plateform after 2015. The current usage metrics is available 48-96 hours after online publication and is updated daily on week days.
Initial download of the metrics may take a while.