Open Access
Fig. 10
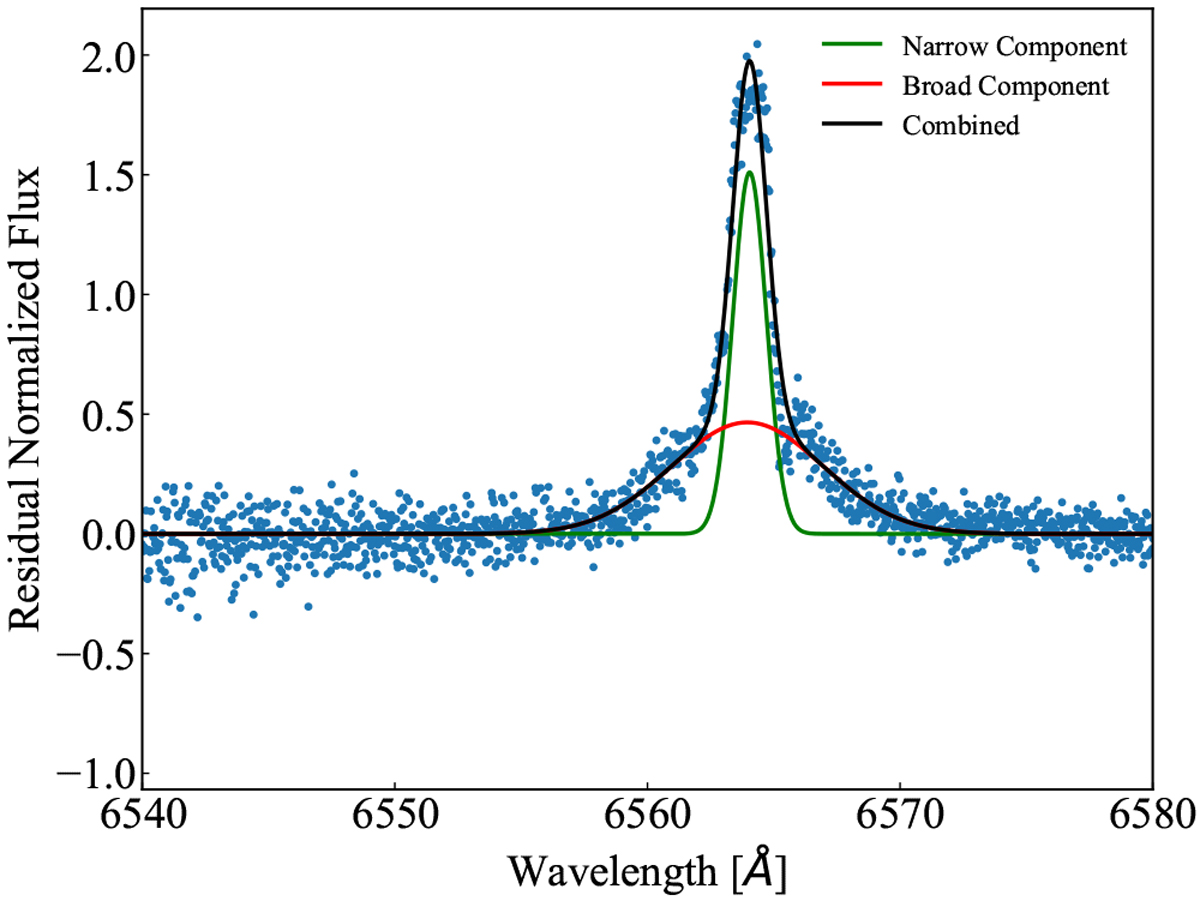
Hα double Gaussian fit for the onset of flare 2. The narrow component (green line) has a shift of − 25.12 km s−1 and the broad component (red line) has a shift of − 29.68 km s−1 from the line core. The combined fit is given by the solid black line.
Current usage metrics show cumulative count of Article Views (full-text article views including HTML views, PDF and ePub downloads, according to the available data) and Abstracts Views on Vision4Press platform.
Data correspond to usage on the plateform after 2015. The current usage metrics is available 48-96 hours after online publication and is updated daily on week days.
Initial download of the metrics may take a while.