Fig. 8.
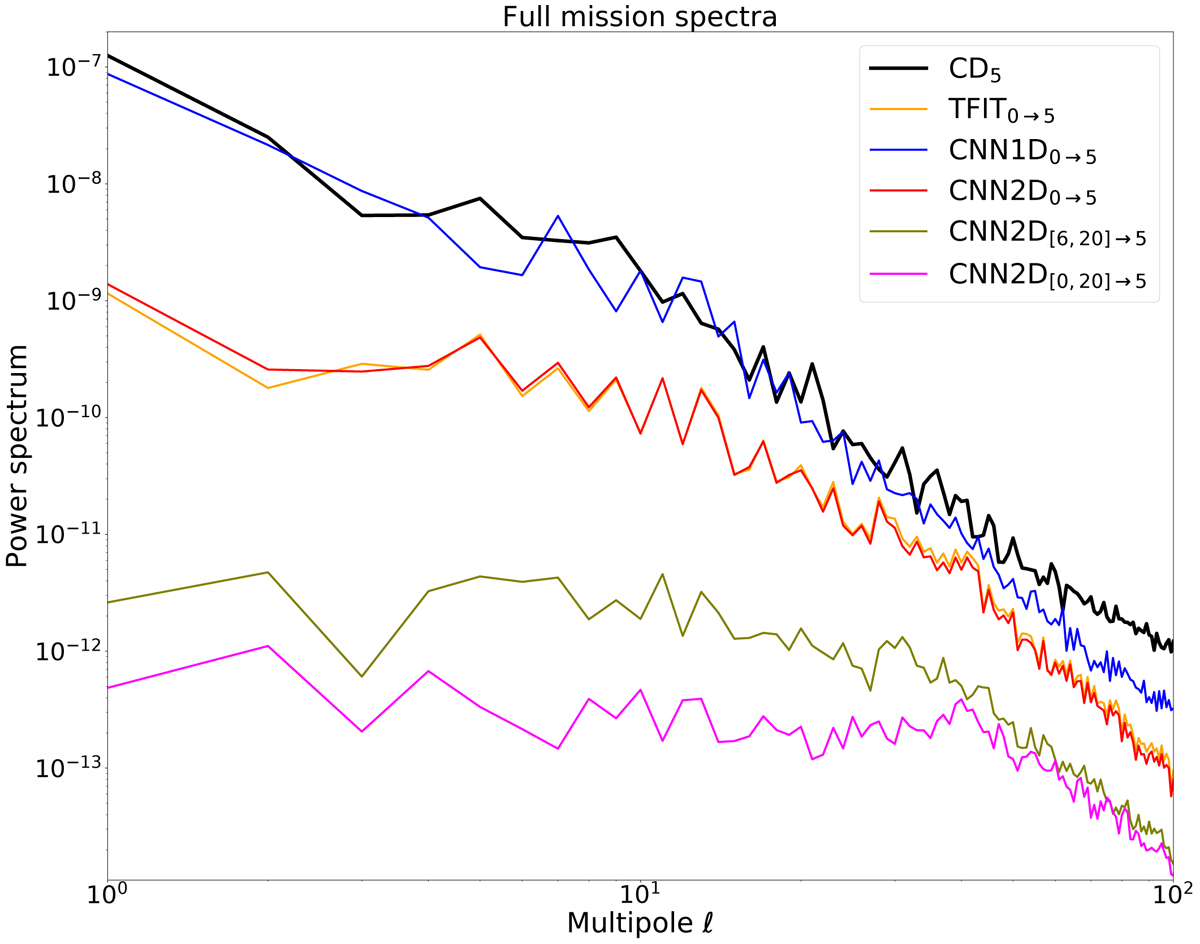
Power spectra of full-mission maps of 5° phase-shifted detector 5451 FSL simulations after contamination-source removal using 1000 iterations of a classic destriping approach (CD5), a direct fit of nonshifted detector 5451 FSL simulation data onto 5° phase-shifted detector 5451 FSL simulation data as a template (TFIT0 → 5), the 1D Decoder CNN trained on nonshifted detector 5451 FSL simulation data and applied to 5° phase-shifted detector 5451 FSL simulation data (CNN1D0 → 5), the 2D Decoder CNN trained on nonshifted detector 5451 FSL simulation data and applied to 5° phase-shifted detector 5451 FSL simulation data (CNN2D0 → 5), the 2D Decoder CNN trained on a catalog built from detector 5451 FSL simulation data shifted by [6° ,8° ,…,20° ] and applied to 5° phase-shifted detector 5451 FSL Simulation data (CNN2D[6, 20]→5), and the 2D Decoder CNN trained on a catalog built from detector 5451 FSL simulation data shifted by [0° ,2° ,…,20° ] and applied to 5° phase-shifted detector 5451 FSL simulation data (CNN2D[0, 20]→5).
Current usage metrics show cumulative count of Article Views (full-text article views including HTML views, PDF and ePub downloads, according to the available data) and Abstracts Views on Vision4Press platform.
Data correspond to usage on the plateform after 2015. The current usage metrics is available 48-96 hours after online publication and is updated daily on week days.
Initial download of the metrics may take a while.