Fig. 5.
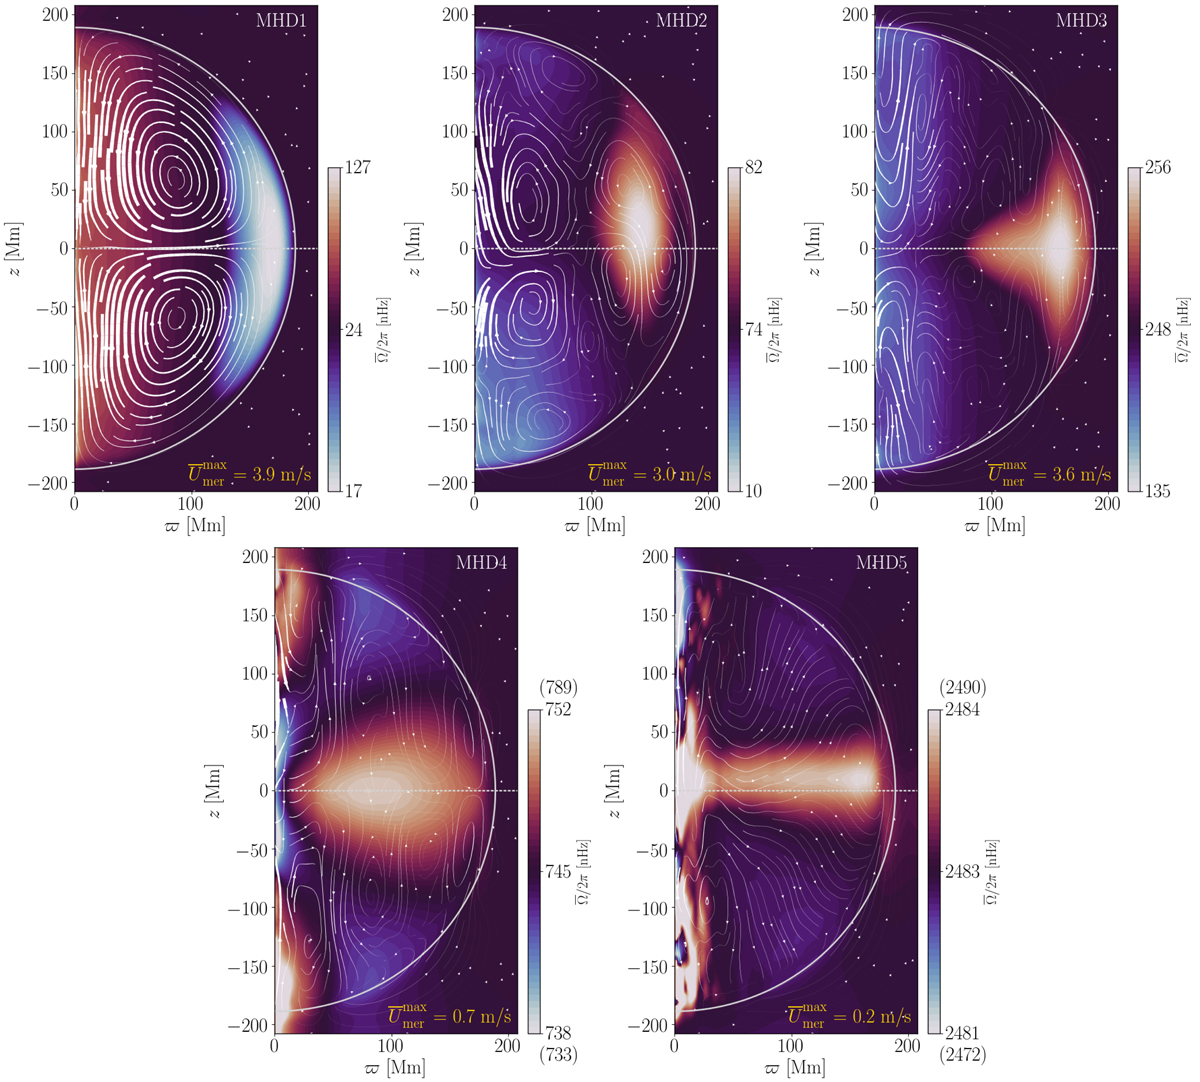
Temporally and azimuthally averaged rotation profiles ![]() for the simulations in set MHD. The values for runs MHD4 and MHD5 are clipped to highlight features near to the equator. The full ranges are indicated in the parenthesis above and below the colour bar. The arrows indicate the mass flux due to meridional circulation
for the simulations in set MHD. The values for runs MHD4 and MHD5 are clipped to highlight features near to the equator. The full ranges are indicated in the parenthesis above and below the colour bar. The arrows indicate the mass flux due to meridional circulation ![]() . The arrow widths are proportional to
. The arrow widths are proportional to ![]() . The maximum meridional flow speeds are indicated in the bottom right corners of each panel.
. The maximum meridional flow speeds are indicated in the bottom right corners of each panel.
Current usage metrics show cumulative count of Article Views (full-text article views including HTML views, PDF and ePub downloads, according to the available data) and Abstracts Views on Vision4Press platform.
Data correspond to usage on the plateform after 2015. The current usage metrics is available 48-96 hours after online publication and is updated daily on week days.
Initial download of the metrics may take a while.