Fig. 3.
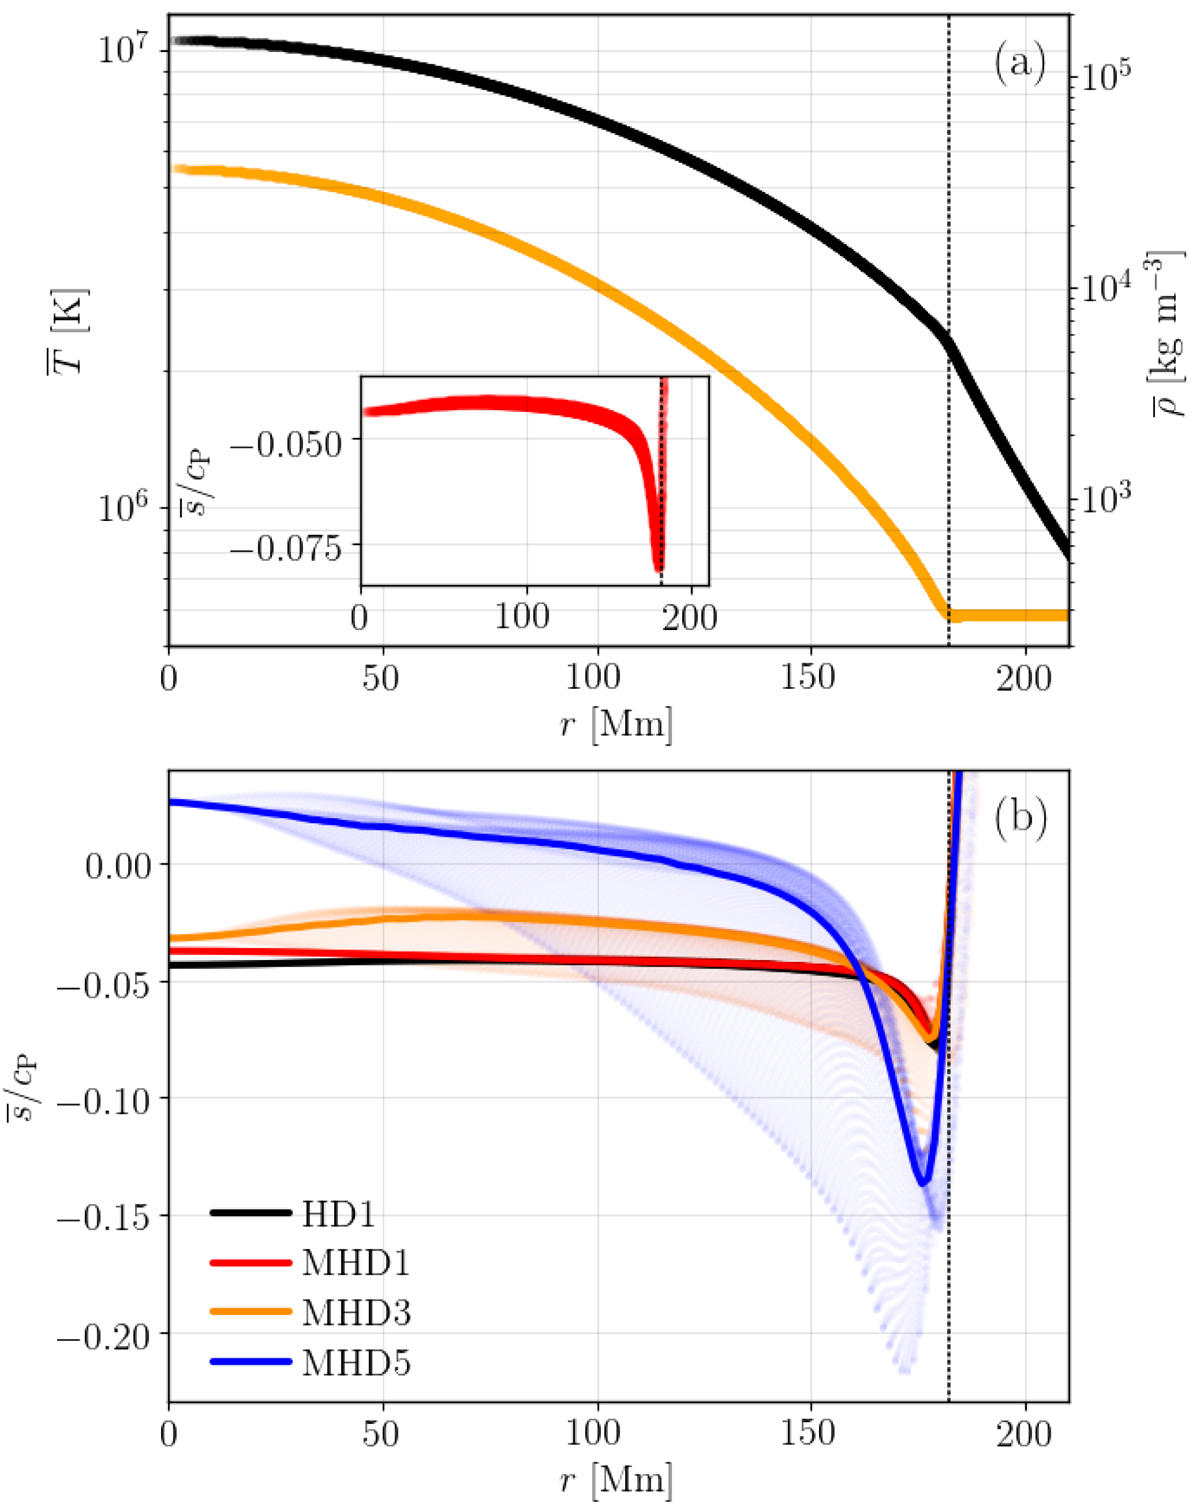
Profiles of mean thermodynamic states from representative runs. Top panel: time-averaged radial profiles of azimuthally averaged temperature ![]() (orange, left axis) and density
(orange, left axis) and density ![]() (black, right axis) as functions of radius from the non-rotating run HD1. The inset shows the radial profile of the mean specific entropy s̄/cP. Bottom: mean specific entropy s̄/cP(r) from runs HD1, MHD1, MHD3, and MHD5 as indicated by the legend. The dots show a scatter plot of s̄(ϖ,θ) as a function of spherical radius r. The dotted vertical line indicates the upper boundary of the convective layer in the non-rotating run HD1.
(black, right axis) as functions of radius from the non-rotating run HD1. The inset shows the radial profile of the mean specific entropy s̄/cP. Bottom: mean specific entropy s̄/cP(r) from runs HD1, MHD1, MHD3, and MHD5 as indicated by the legend. The dots show a scatter plot of s̄(ϖ,θ) as a function of spherical radius r. The dotted vertical line indicates the upper boundary of the convective layer in the non-rotating run HD1.
Current usage metrics show cumulative count of Article Views (full-text article views including HTML views, PDF and ePub downloads, according to the available data) and Abstracts Views on Vision4Press platform.
Data correspond to usage on the plateform after 2015. The current usage metrics is available 48-96 hours after online publication and is updated daily on week days.
Initial download of the metrics may take a while.