Free Access
Fig. 7.
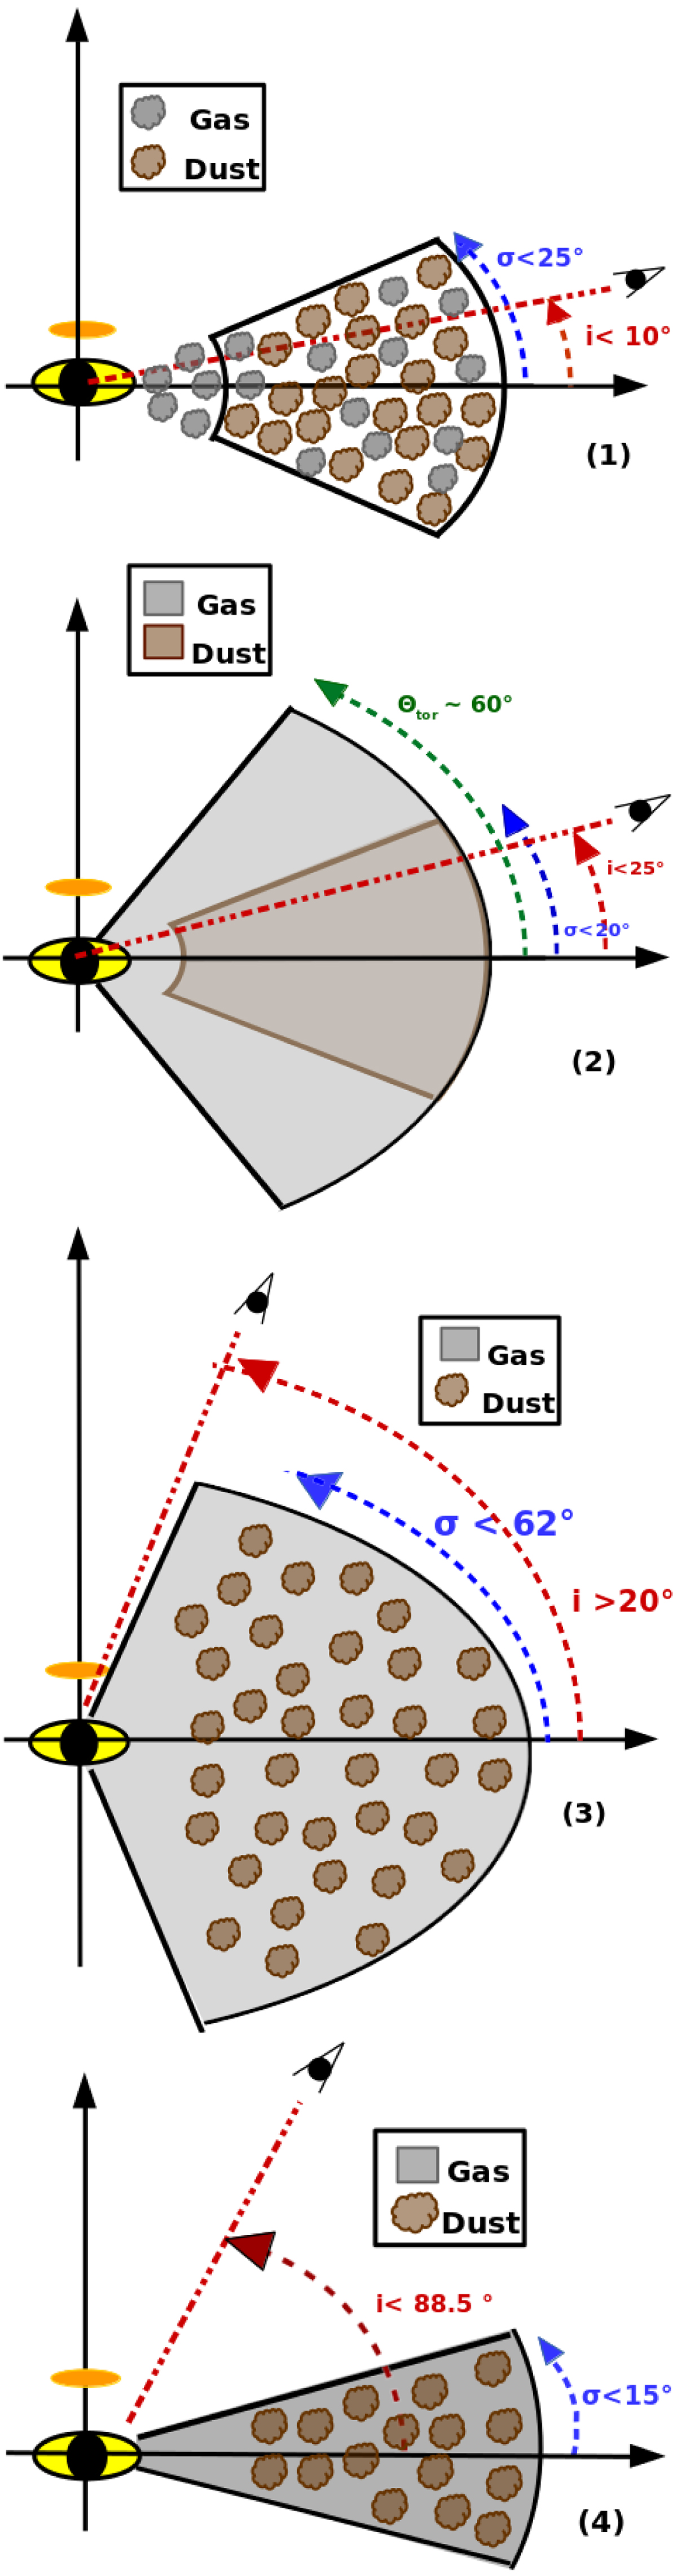
Illustrations of different gas/dusty tori for some Sy1s in our sample according to the properties gathered in Table D.1. The orange and yellow circles show the corona and accretion disk, respectively. The red dashed line shows the l.o.s. (see text for more details).
Current usage metrics show cumulative count of Article Views (full-text article views including HTML views, PDF and ePub downloads, according to the available data) and Abstracts Views on Vision4Press platform.
Data correspond to usage on the plateform after 2015. The current usage metrics is available 48-96 hours after online publication and is updated daily on week days.
Initial download of the metrics may take a while.